April 19, 2019
In my more recent conversations with customers, visualizing and drawing dependencies of load-balancers is becoming a common theme. Load-Balancers are very critical entities within datacenter applications that provide –
a) Efficient distribution of client traffic across application servers.
b) High availability and reliability of application traffic.
c) Flexibility to add or remove application servers as per the demand.
Over the past few years with virtualization and cloud technologies, physical load balancing is no longer an option. Moreover, commonly used platforms such as VMware NSX, AWS and Microsoft Azure provide built-in load balancing options. Software based load-balancers are also convenient since they can be deployed on demand and cost effective since they do not have any bulky hardware.
As the load balancing technologies have evolved from the simple round robin and least connection methods to the sophisticated IP hashing methods, it becomes much harder to identifying the source of issues with Load Balancers. This is where Application Dependency Maps come in handy.
With the usage of Application Dependency Maps, you can –
1) Identify any Network issues between the Load Balancers and the Web Servers
2) Identify if the load is being balanced correctly at any given time frame
With a tool such as Uila, you can visualize the Application Dependency Maps for the applications that are being load balanced.
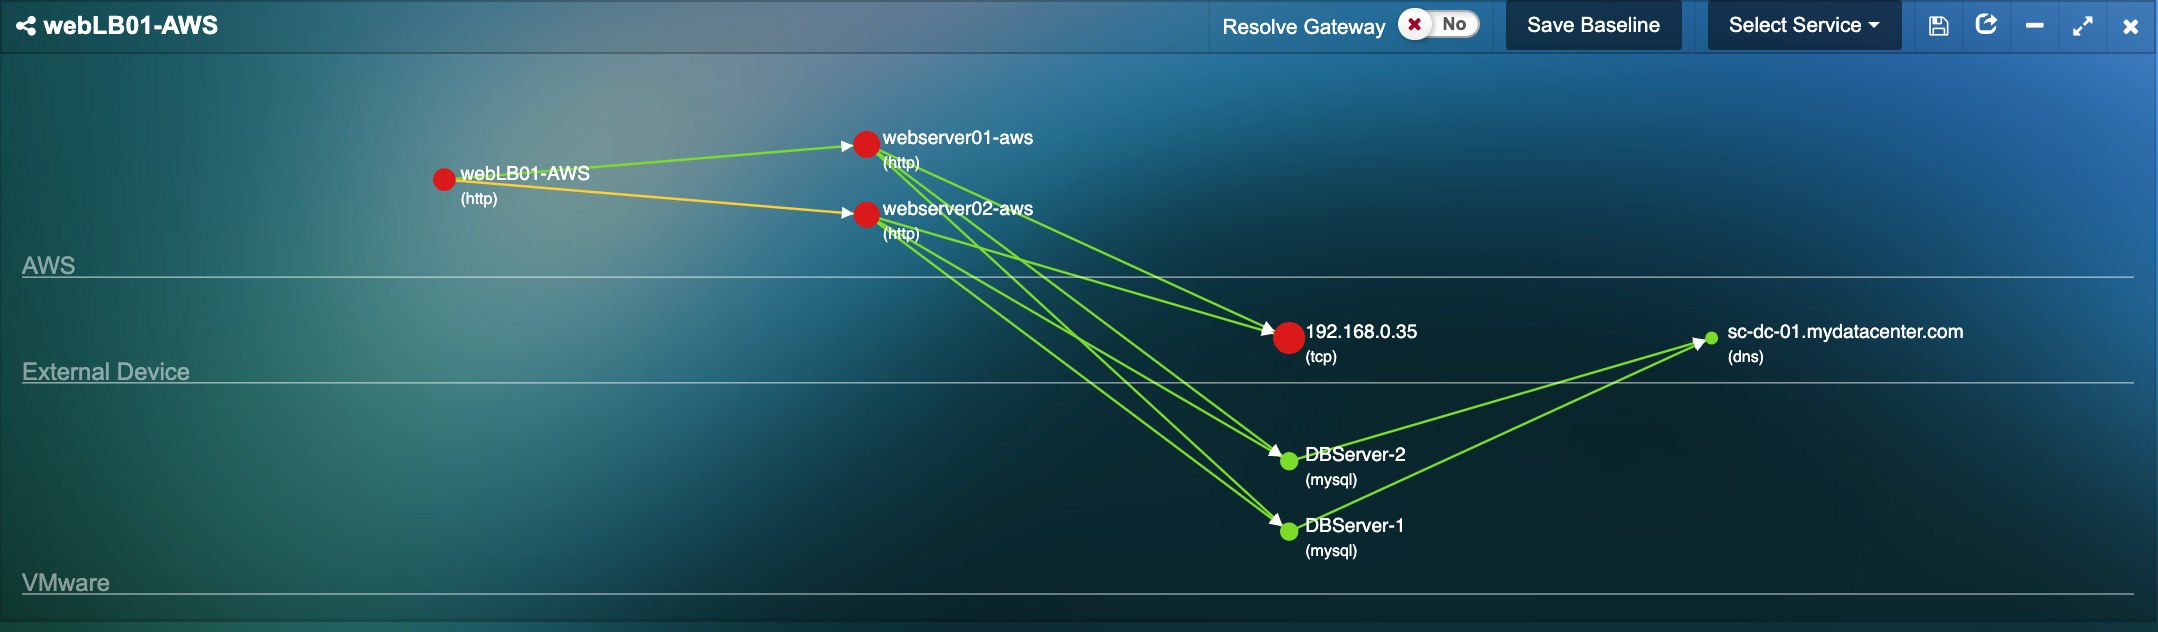
The connection in the diagram below shows the connection traversing across cloud boundaries. The AWS load-balancer splits the connection between the 2 different web-servers. The Web-servers in turn communicate with the databases on-premise.
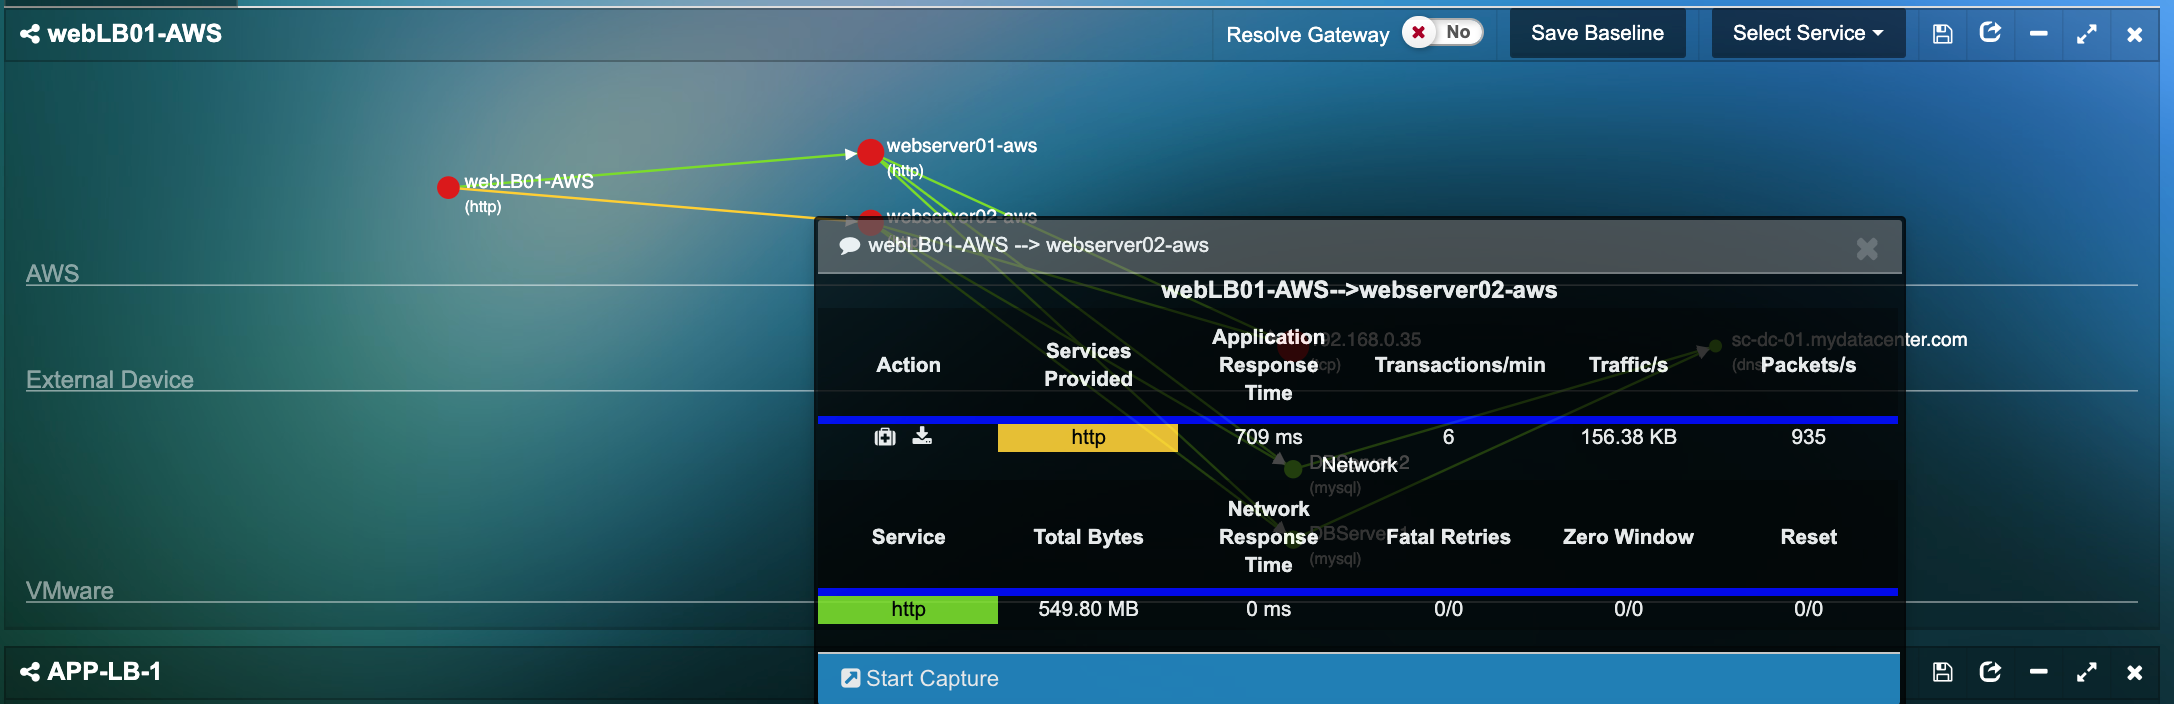
You can also identify the network bandwidth and latencies as the load balancer connects to the webservers.
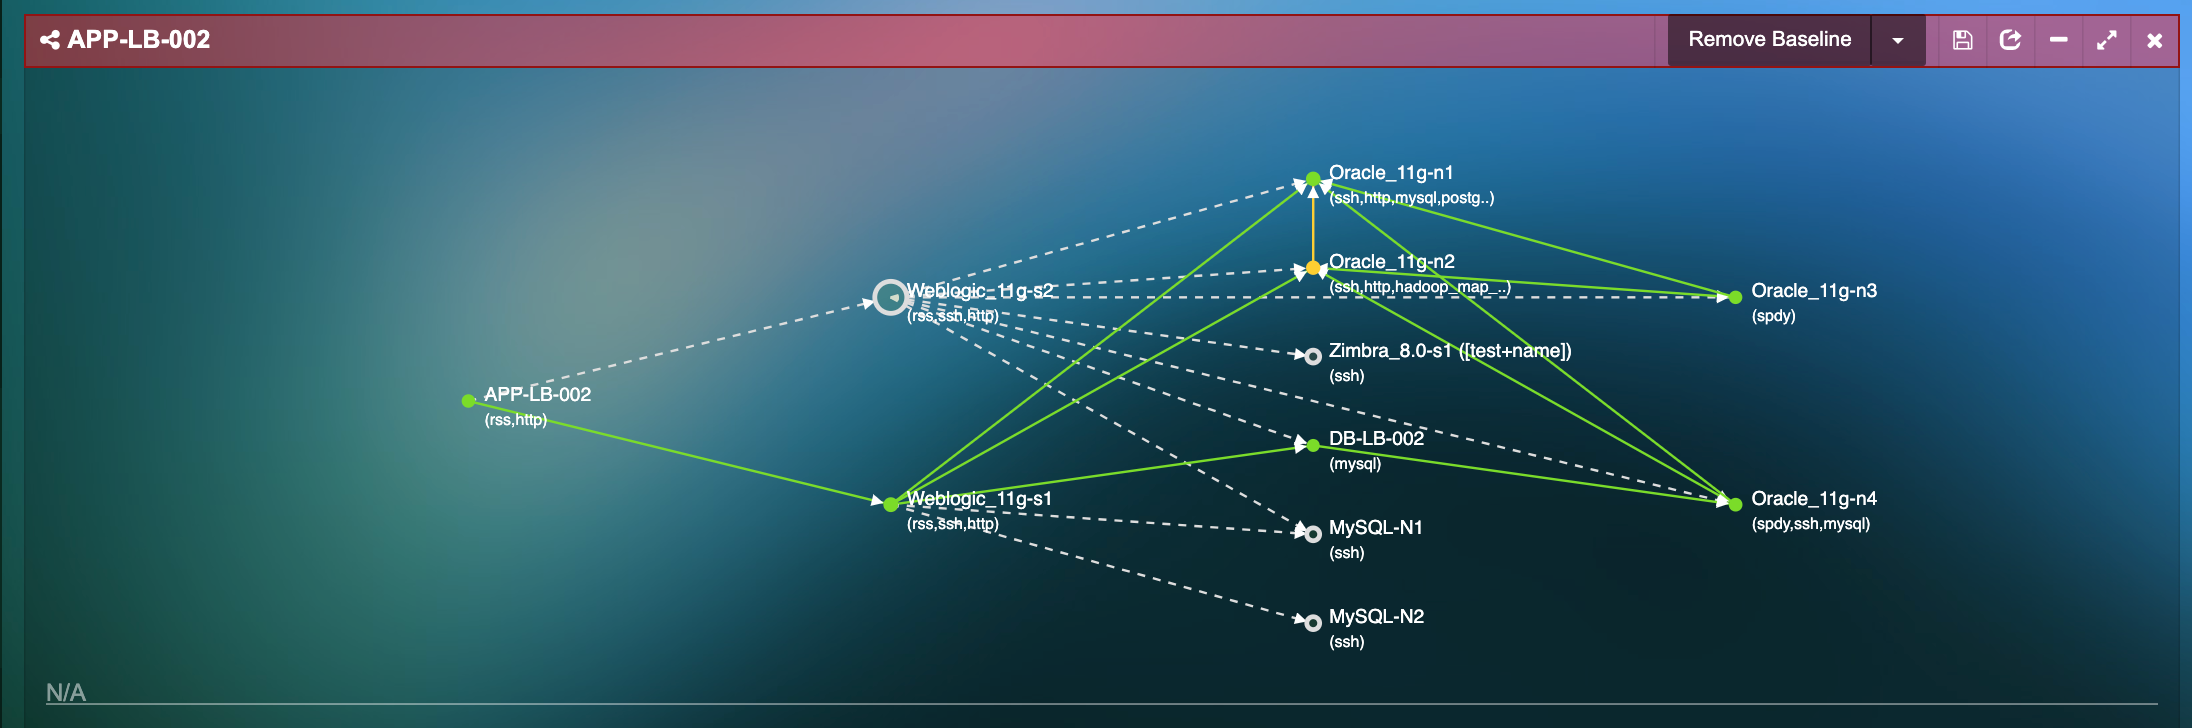
If there are any changes in application servers that are being load-balanced, Uila can also identify those. The gray line between the Load Balancer and the webserver shows that the Load Balancer is not sending out requests to a particular webserver.
Uila’s Application Dependency Maps can be used to visualize both Physical as well as Virtual Load-Balancers. With this feature the users can get an in-depth view of their workloads within their environment.
Note: This article was witten by Aditya Krishnan, TME at Uila and published originally on his personal blog site http://www.dcdummy.com/.
Note: This article was witten by Aditya Krishnan, TME at Uila and published originally on his personal blog site http://www.dcdummy.com/.
Subscribe
Latest Posts
- Application and Infrastructure Challenges for Utility Companies
- Troubleshooting Exchange Server Issues in Data Centers
- Importance of Application Dependency Mapping for IT Asset Inventory Control
- Navigating the Flow: Understanding East-West Network Traffic
- The imperative of full-stack observability
- What's new in Uila uObserve v5.5
- What's new in Uila uObserve 5.1?
- Most important aspect of VDI troubleshooting
- Importance of logging analysis in the Observability World
- Uila Success Story: Baron Capital


