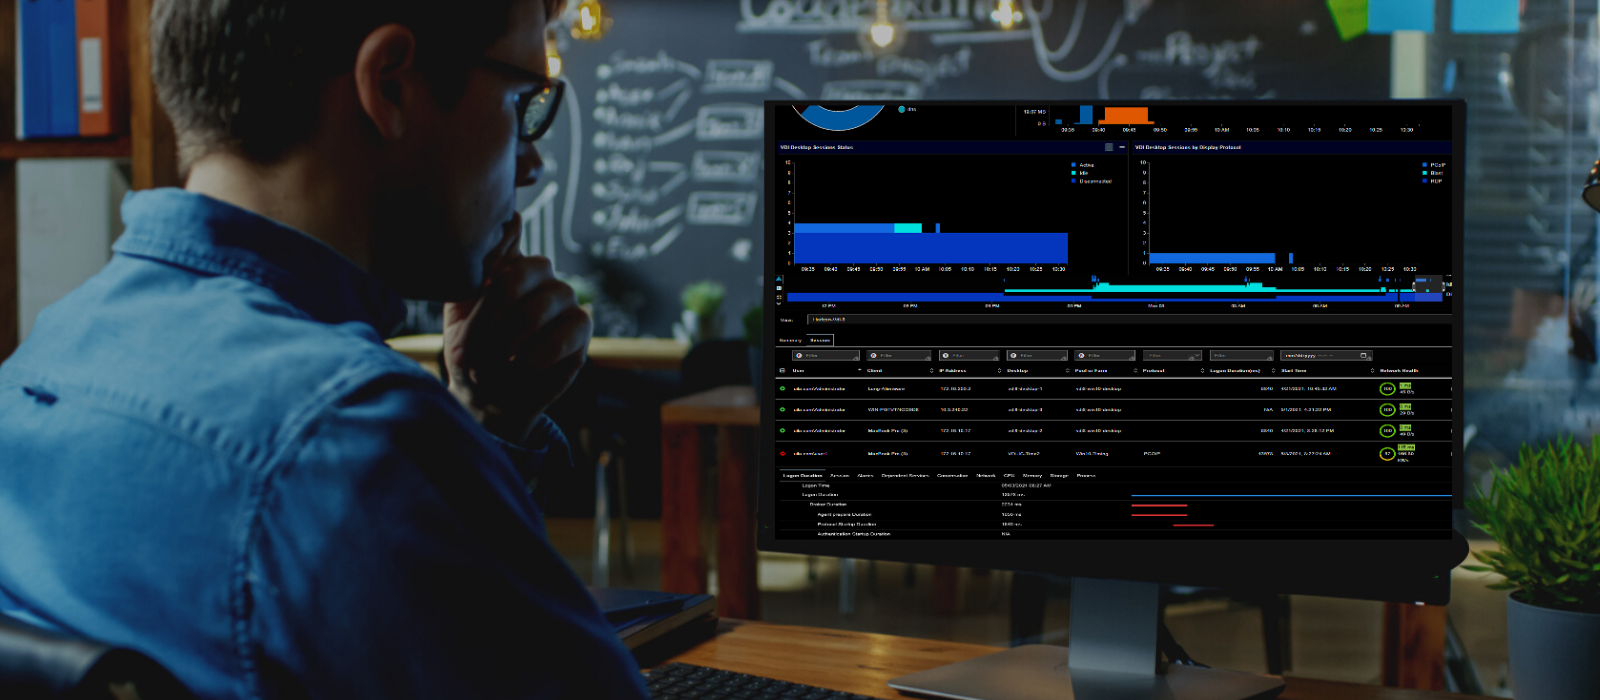
Challenges with monitoring the modern desktop environment
.png)
-
Desktop environments have gone a systemic evolution, especially during the pandemic times. VDI is become the most preferred desktop environment choice for most enterprise
organizations. Even though VDI brings its shared resource advantage, it is
not free of problems. There exist many opportunities for desktop teams
to optimize their environment to provide the maximized performance for their
desktop environment.
- How many current active VDI sessions?
- What VDI protocols are in use?
- Why is my login very slow?
- What applications are being used by the VDI users?
- Why is my Application access so slow?
- What components make up my entire VDI infrastructure?
- Are the performance problems due to the user's home connection?
- Why am I seeing so many application time-outs?
- Is my VDI infrastructure impacted due to network issues?
- Is my VDI infrastructure's CPU and Memory resources optimized for the maximized performance?
- Is my VDI deployment secure?
- Which users are using the GPU resources?
- Is there enough memory for GPU?
Desktop engineers need answers to questions like:
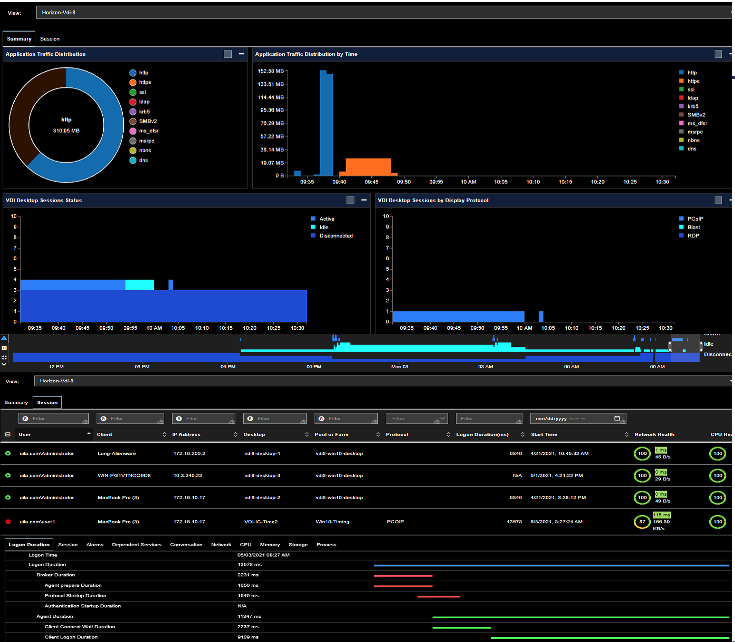
VMware Horizon User Session Analysis
.png)
- Visualize session data for your entire VDI deployment or customize view for your Pools, Pods or Sites.
- Insights into detailed user sessions for VMware Horizon deployments. Visualize Active, idle and disconnected sessions.
- Visualize username, associated virtual desktop VM, session start time, pool or farm information, etc.
- Measure time for every stage in the logon process like broker duration, agent duration, app launch duration, etc. and isolate issues leading to failed or slow logons.
- Visualization of Blast Extreme and PCOIP RX and TX Packet Loss, Round-Trip Time, User session latency, bandwidth, etc.
- Insights into Application traffic from VDI desktop as a client connects to application servers (e.g. Zoom, ERP, Databases, EHR, etc.)
- Detailed information on the Windows Desktop Processes.
Nvidia GPU Monitoring
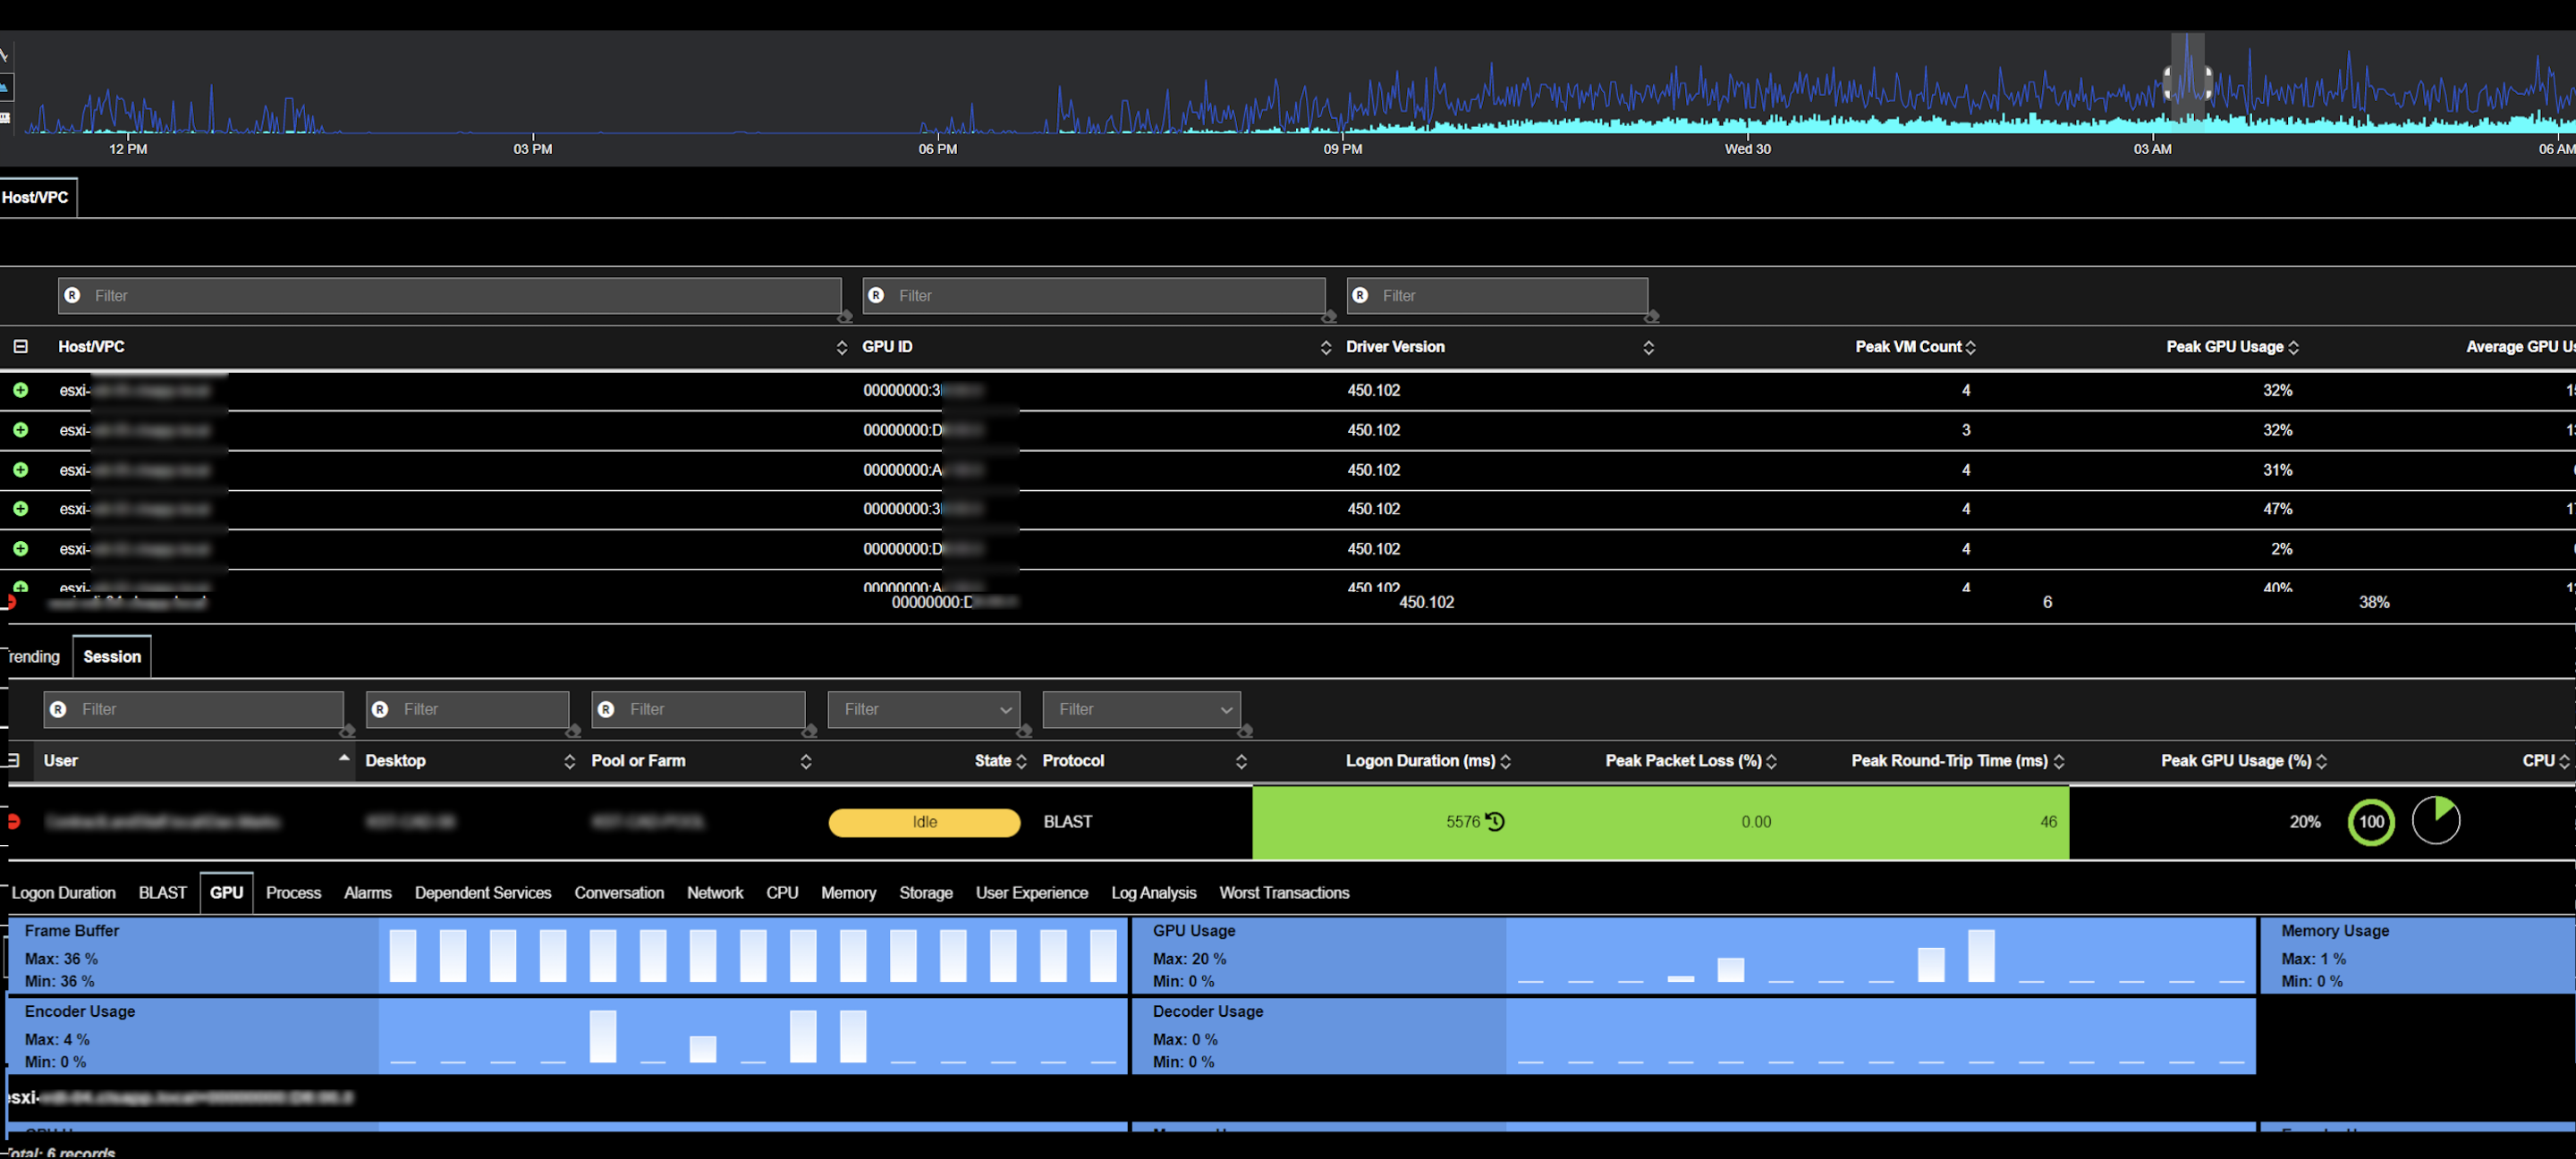
- Intelligent NVIDIA GPU metrics using the NVIDIA System Management Interface (NVSMI) to allow desktops teams to provide the maximized performance for GPU-enabled virtual desktops.
- Critical GPU insights like VM-level Peak GPU usage, frame buffer, GPU decoder/encoder usage, memory usage, etc. for the individual user sessions.
- GPU host level metrics like GPU ID, driver version, peak VM counts, peak/average GPU & memory usage.
- User-friendly GPU usage report to be delivered at a time of their convenience.
Automated VDI Components Discovery
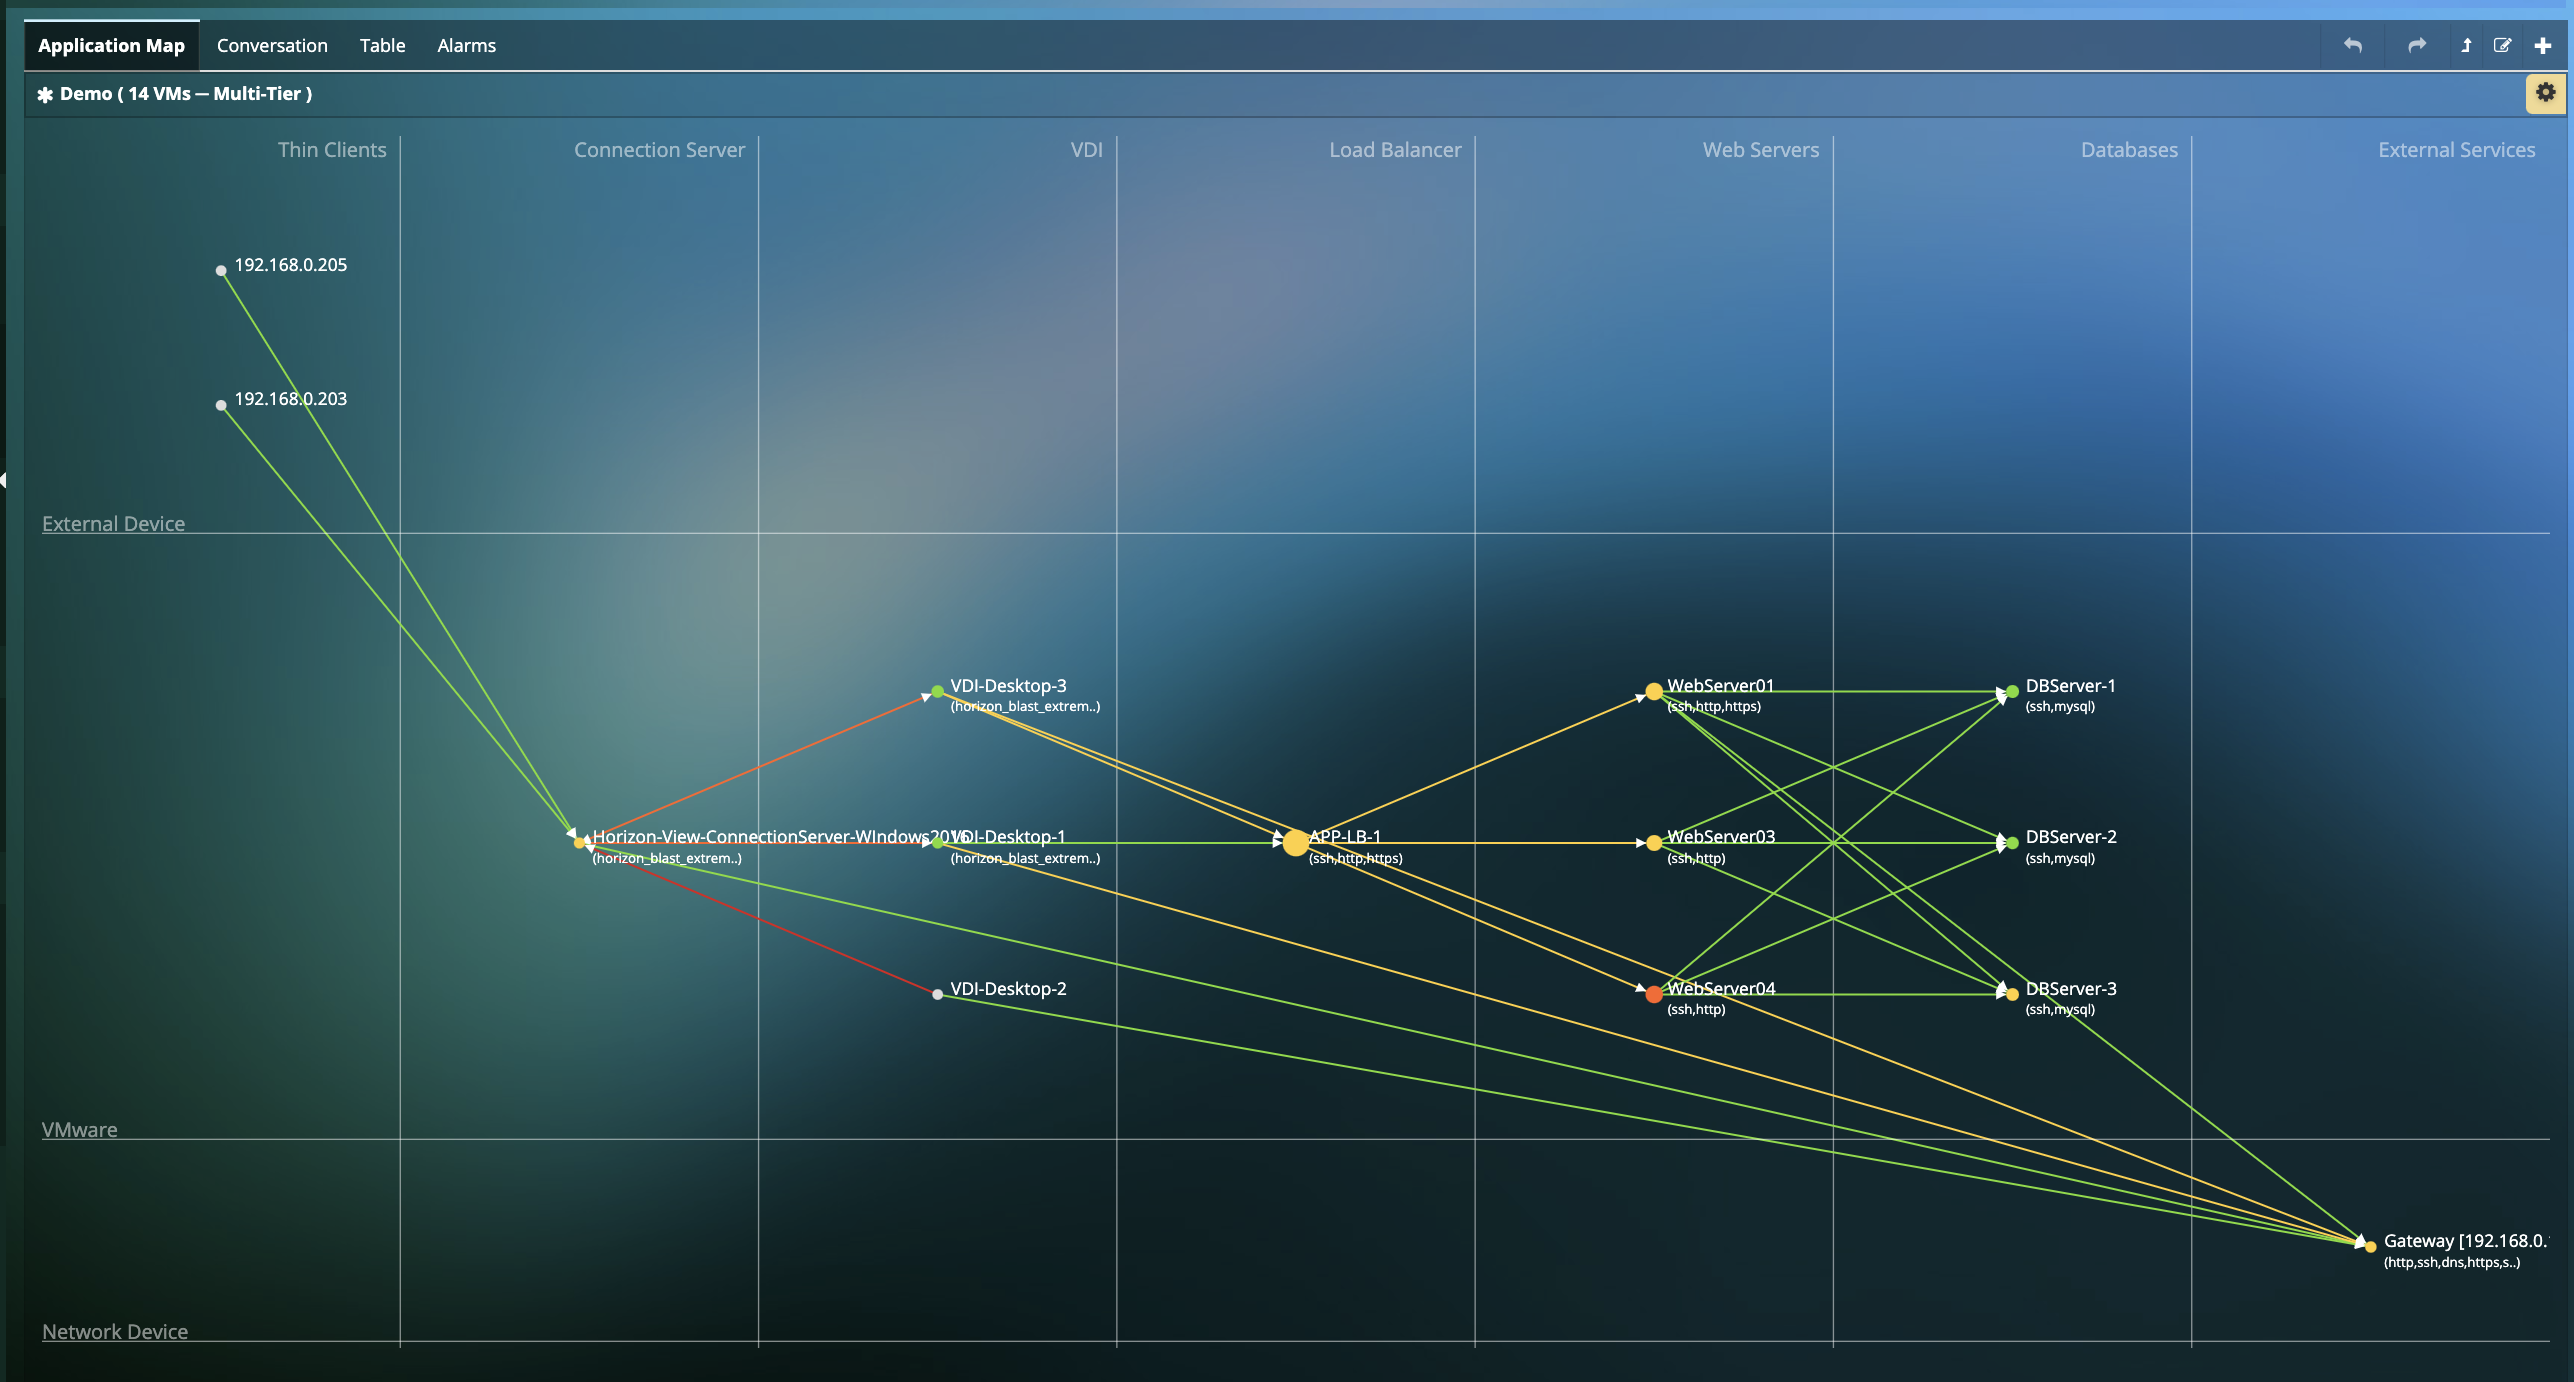
- Reduced time to value with Automated discovery of VDI Components (end-to-end from user clients to virtual desktops to backend application and connection servers) and all interdependencies for VMware Horizon and Citrix deployments.
- Troubleshoot issues proactively directly from the Dependency Map down to the Application, Network or Infrastructure.
- No manual updates or interventions needed to build the Dependency mapping. Install Uila, and we will build the maps automatically with NO code changes needed.
- Identify challenges with individual applications running for every VDI user and virtual desktop.
Resources
-
Uila VDI Troubleshooting BrochureQuick Solution brief on Uila for VDI End-to-end Monitoring & Troubleshooting.
-
Reducing Unplanned Downtime and Troubleshooting time for VDI/EUC DeploymentsQuick video that talks about the challenges faced by Desktop teams and how they can reducing unplanned downtime and troubleshooting time for VDI/EUC Deployments.
Ready to begin your Monitoring Journey with Uila
Start a 21-day Free Trial Now
Request Trial


