Highest User Performance Expectation for all services

-
Data centers have become a strategic asset for telecom service providers who have the opportunity to reduce operational expenses, as well as deliver services more cost-effectively and efficiently.
For every Telecom Service Provider, it is all about providing the best performance and user experience for content delivery, mobile services and cloud services. This includes the telco's initiative of implementing next-generation 4G/5G networks, transitioning infrastructure with Network Function Virtualization (NFV),Internet of Things (IoT), Cable and Wi-Fi services. Providing the highest application transaction performance is what helps service providers stay ahead of competition. Telecom Service Providers are seeing vast increases in data volumes as well as major IT transformations in their environment.
Observability for a Better User Experience

-
Telecom Service Providers need constant visibility into the performance of the applications and infrastructure and need to resolve any outage or performance issues as soon as possible.
To support the initiatives and the tsunami of data, Service Providers are not only expanding their Data Center footprint, but also leveraging Public Cloud Services for their unique scalability and elasticity needs. However, even at large scales the expectation from the Service Providers is to leverage existing infrastructure and cloud resource investment to its maximum extent. Thus planning for upgrades or consolidation/lifecycle initiatives are critical to the provider. As the service boundaries for the applications may cross cloud boundaries, it has become very important for Service Providers to have complete end-to-end visibility into their multi-tier service, whether it is in the Data Center or Public Cloud or spanning across both.
The providers need to ensure the highest network uptime, improve their capacity projections, minimize customer churn, and maintain the most optimal health of their growing infrastructure.
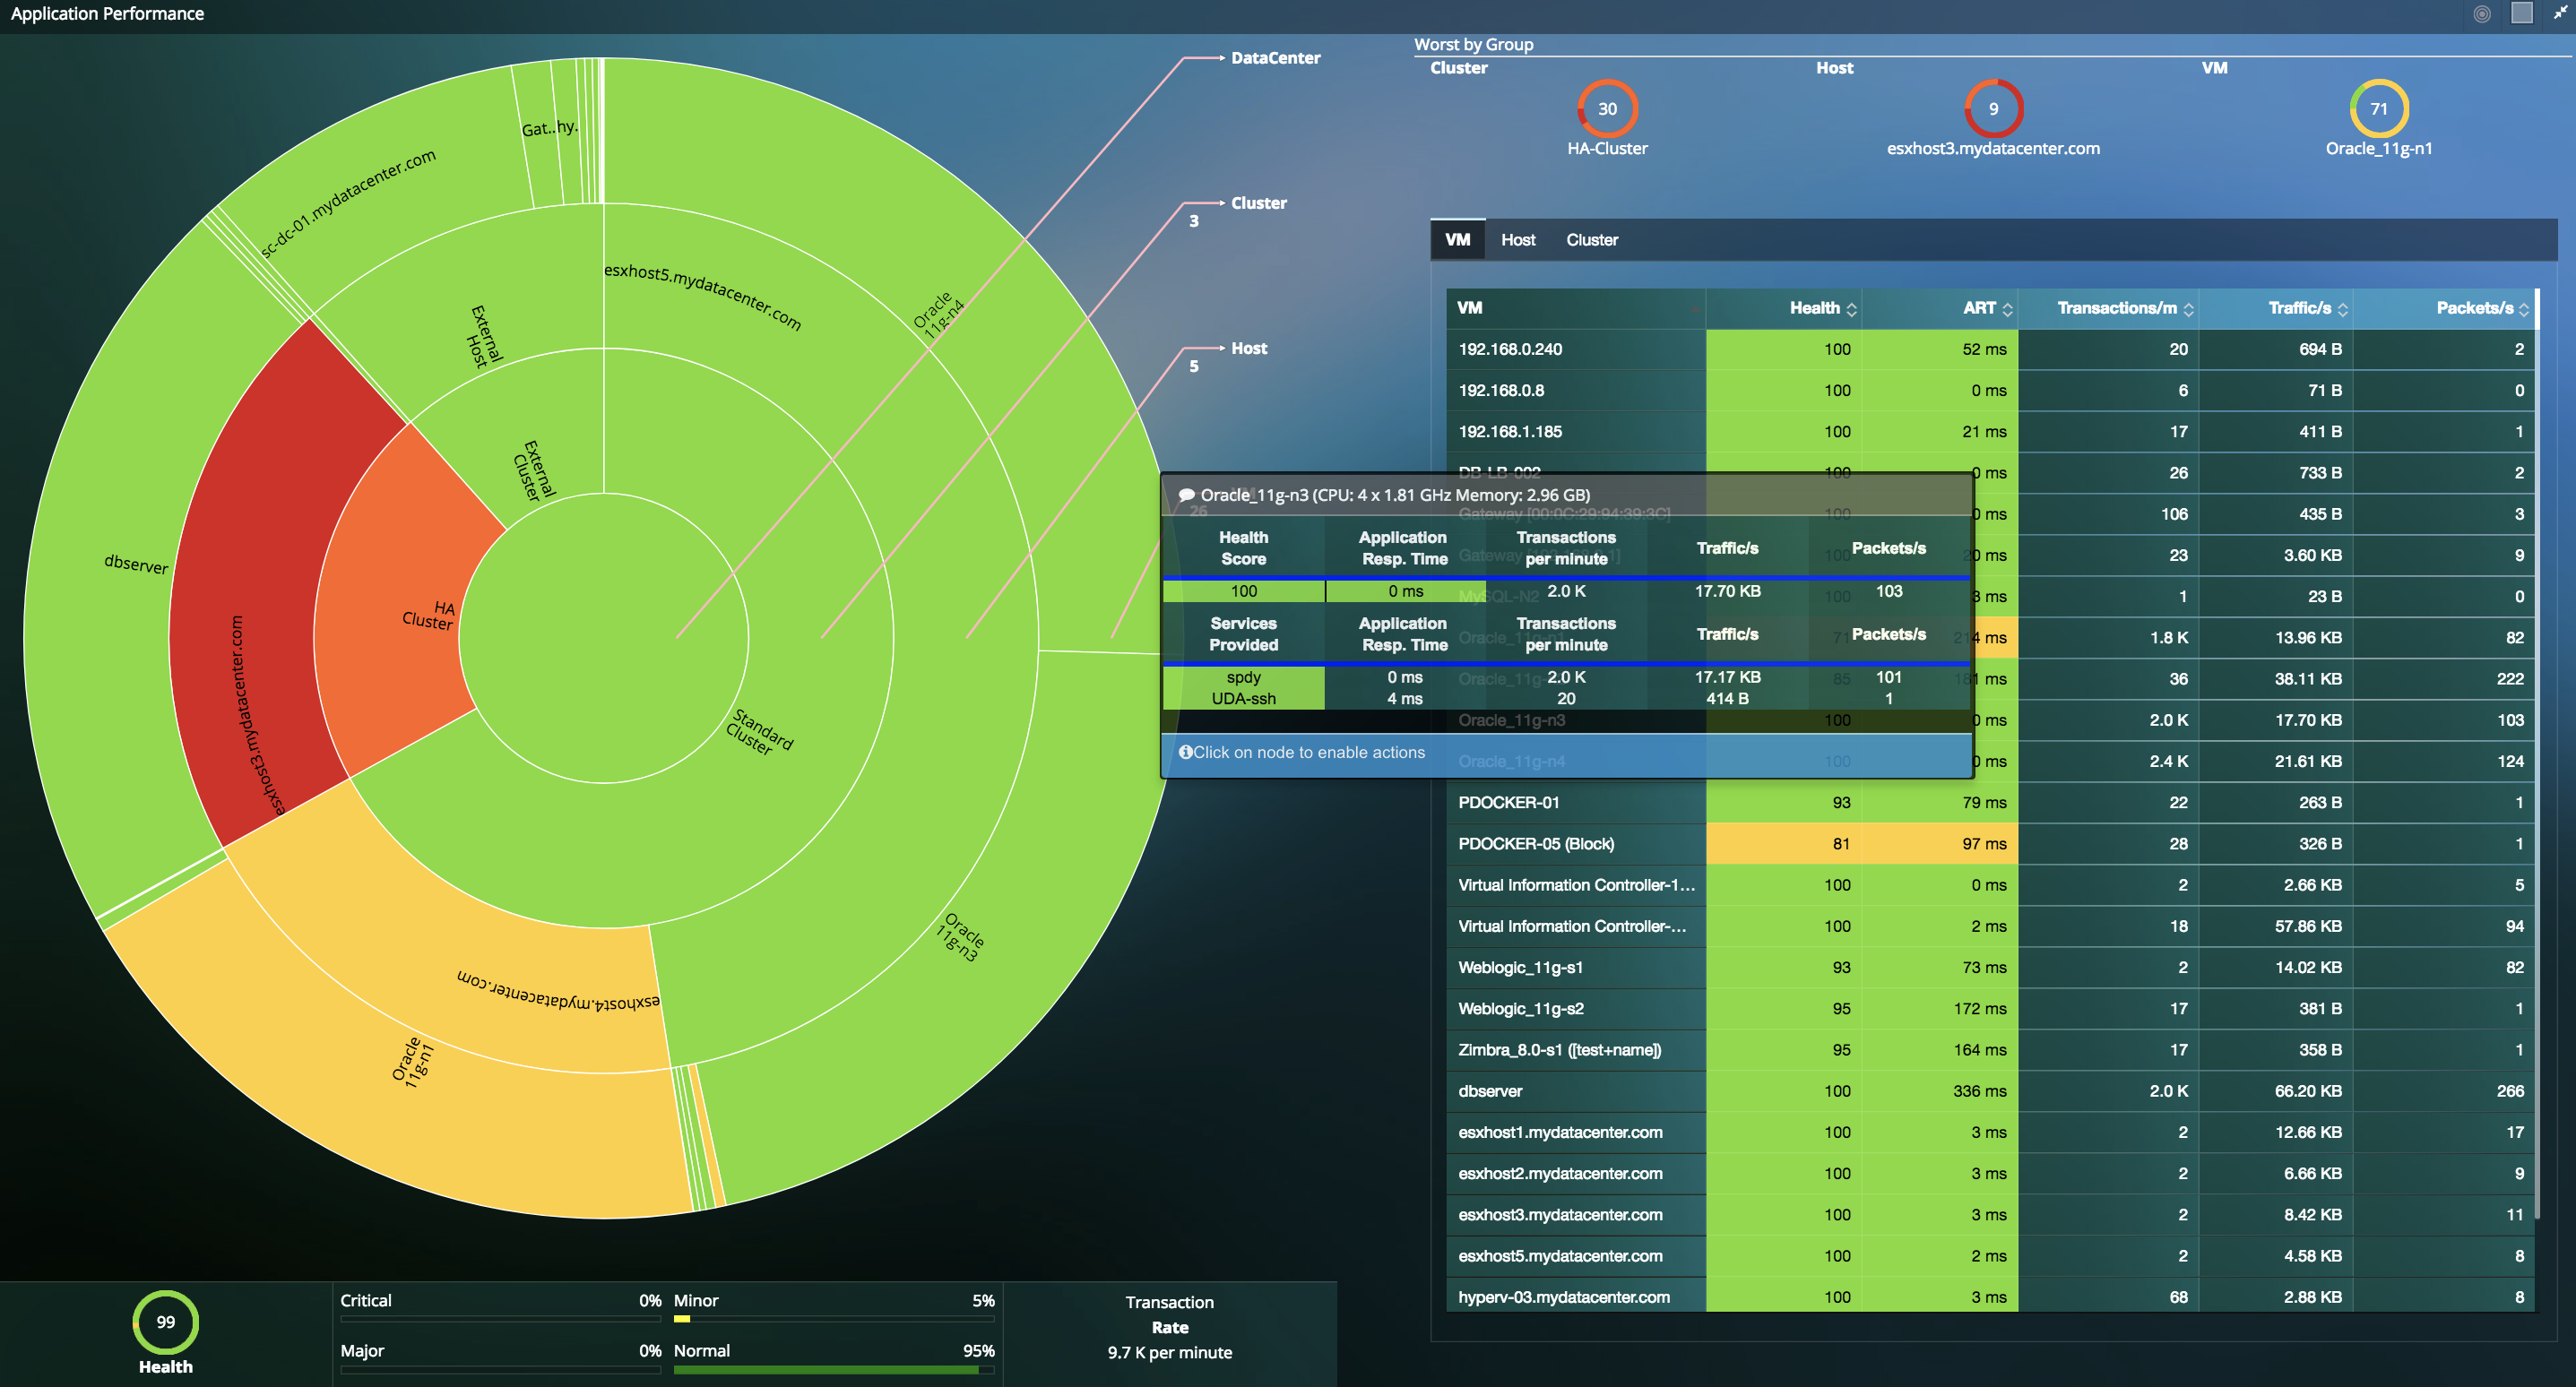
Full Stack Observability in a Single Product
- Align business and IT Operations goals in a single product with application visibility and correlated network, compute and storage insights to solve problems before end-user impact.
- Reduce time in War room conversations and instead focus on business acceleration projects.
- Full stack visibility (Application Performance Monitoring, Infrastructure Performance Monitoring, Network Monitoring, Storage Monitoring) for virtualized data centers reduces troubleshooting time from days to minutes, enabling lean IT teams to get time back for more strategic projects
- Identify blind spots in the infrastructure, and eliminate finger pointing between infrastructure and application teams with automated root cause and forensics.
Read more about full-stack monitoring with Uila by clicking the button below:
Full-Stack Monitoring
Shape your Cloud & Infrastructure Investment
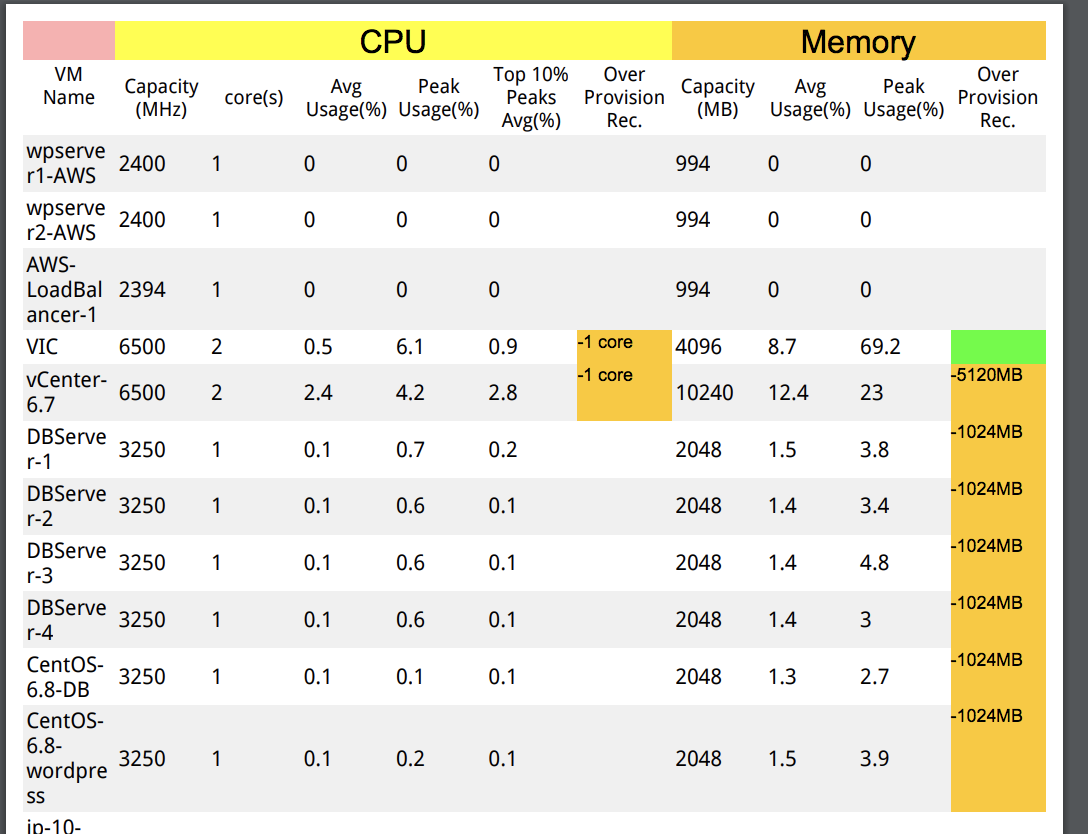
- Optimize cloud costs and coordinate with cloud governance teams based on actual usage and uncover inefficiencies so that you can reduce waste.
- Visualize under-provisioned hosts or instances leading to application performance issues.
- Visualize money left on the table with over-provisioned cloud assets across multiple cloud providers.
- Visualize VM and Instance performance and utilization for a variety of resources including CPU, Memory and compare usage trends with allocated resources.
- Visualize zombie or unused cloud components with Uila's Change Control monitoring capability.
Agentless & Seamless Discovery for over 4,200 applications
.png)
- Application auto-discovery for over 4,200 applications and protocols with deep packet inspection.
- Review Application Response times, Transaction volume and Traffic volume for each individual application without interfering with their existing processes and services.
- Automated DPI to classify previously unknown traffic using embedded machine-learning algorithms.
- IT teams can identify blind spots in the infrastructure, and eliminate finger pointing between infrastructure and application teams with automated root cause and forensics.
Automatically Discover & Document Application & Server Dependencies involved in the entire Service Delivery Process
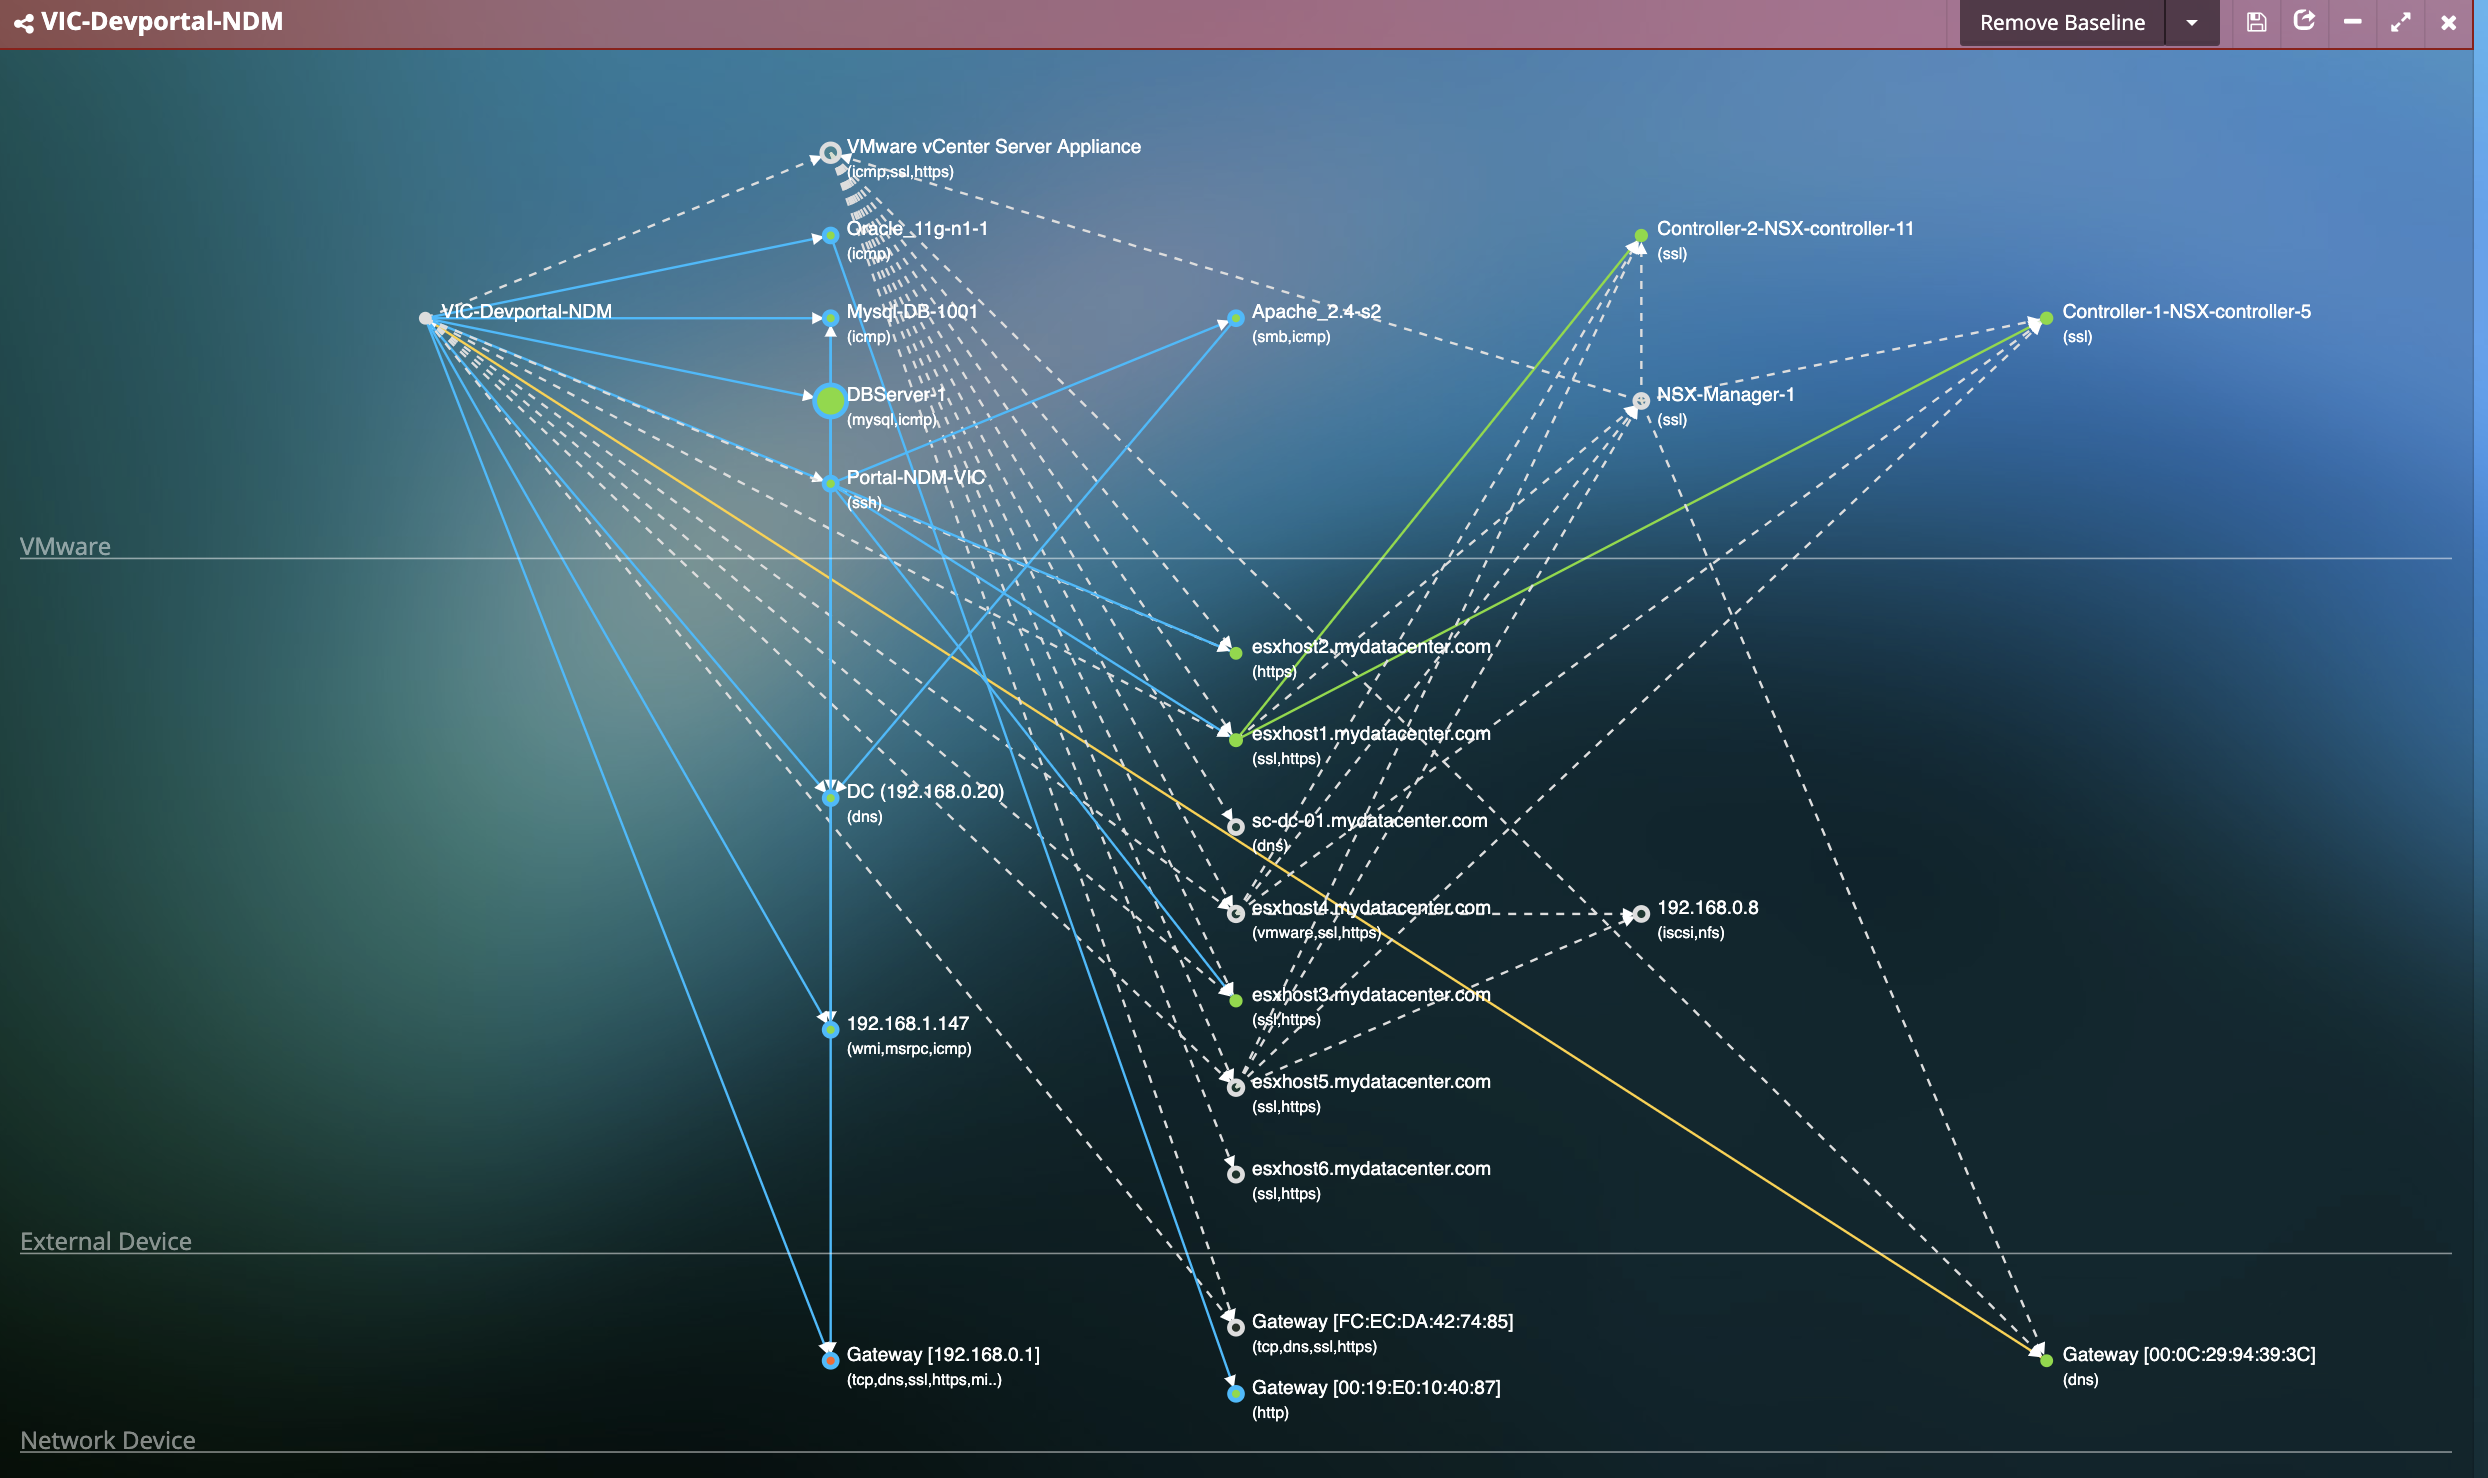
- In-depth understanding of the assets in the data center and their interdependencies.
- Reduced Time to Value with automatic discovery of the topology map for multi-tier applications, because when migrating an application, you need to know all the servers and processes the application is using.
- Troubleshoot issues proactively at lightning speeds with full visibility into the dependencies across applications and infrastructure. View each application service performance by its response time and transaction load on the associated VMs.
- No manual updates or interventions needed to build the Dependency mapping. Install Uila, and we will build the maps automatically with NO code changes needed.
- Application dependency and topology mapping provides critical insight for defining Migration & Disaster recovery Strategies.
- Overcome poor documentation practices or knowledge transfer of dependencies due to employee turnover.
- Key Performance Indicators such as Application Response Time, Transaction Volume, packets, etc. for every application discovered.
- Compare past dependencies with before and after change monitoring.
Deeper Intelligence for Applications for your customers
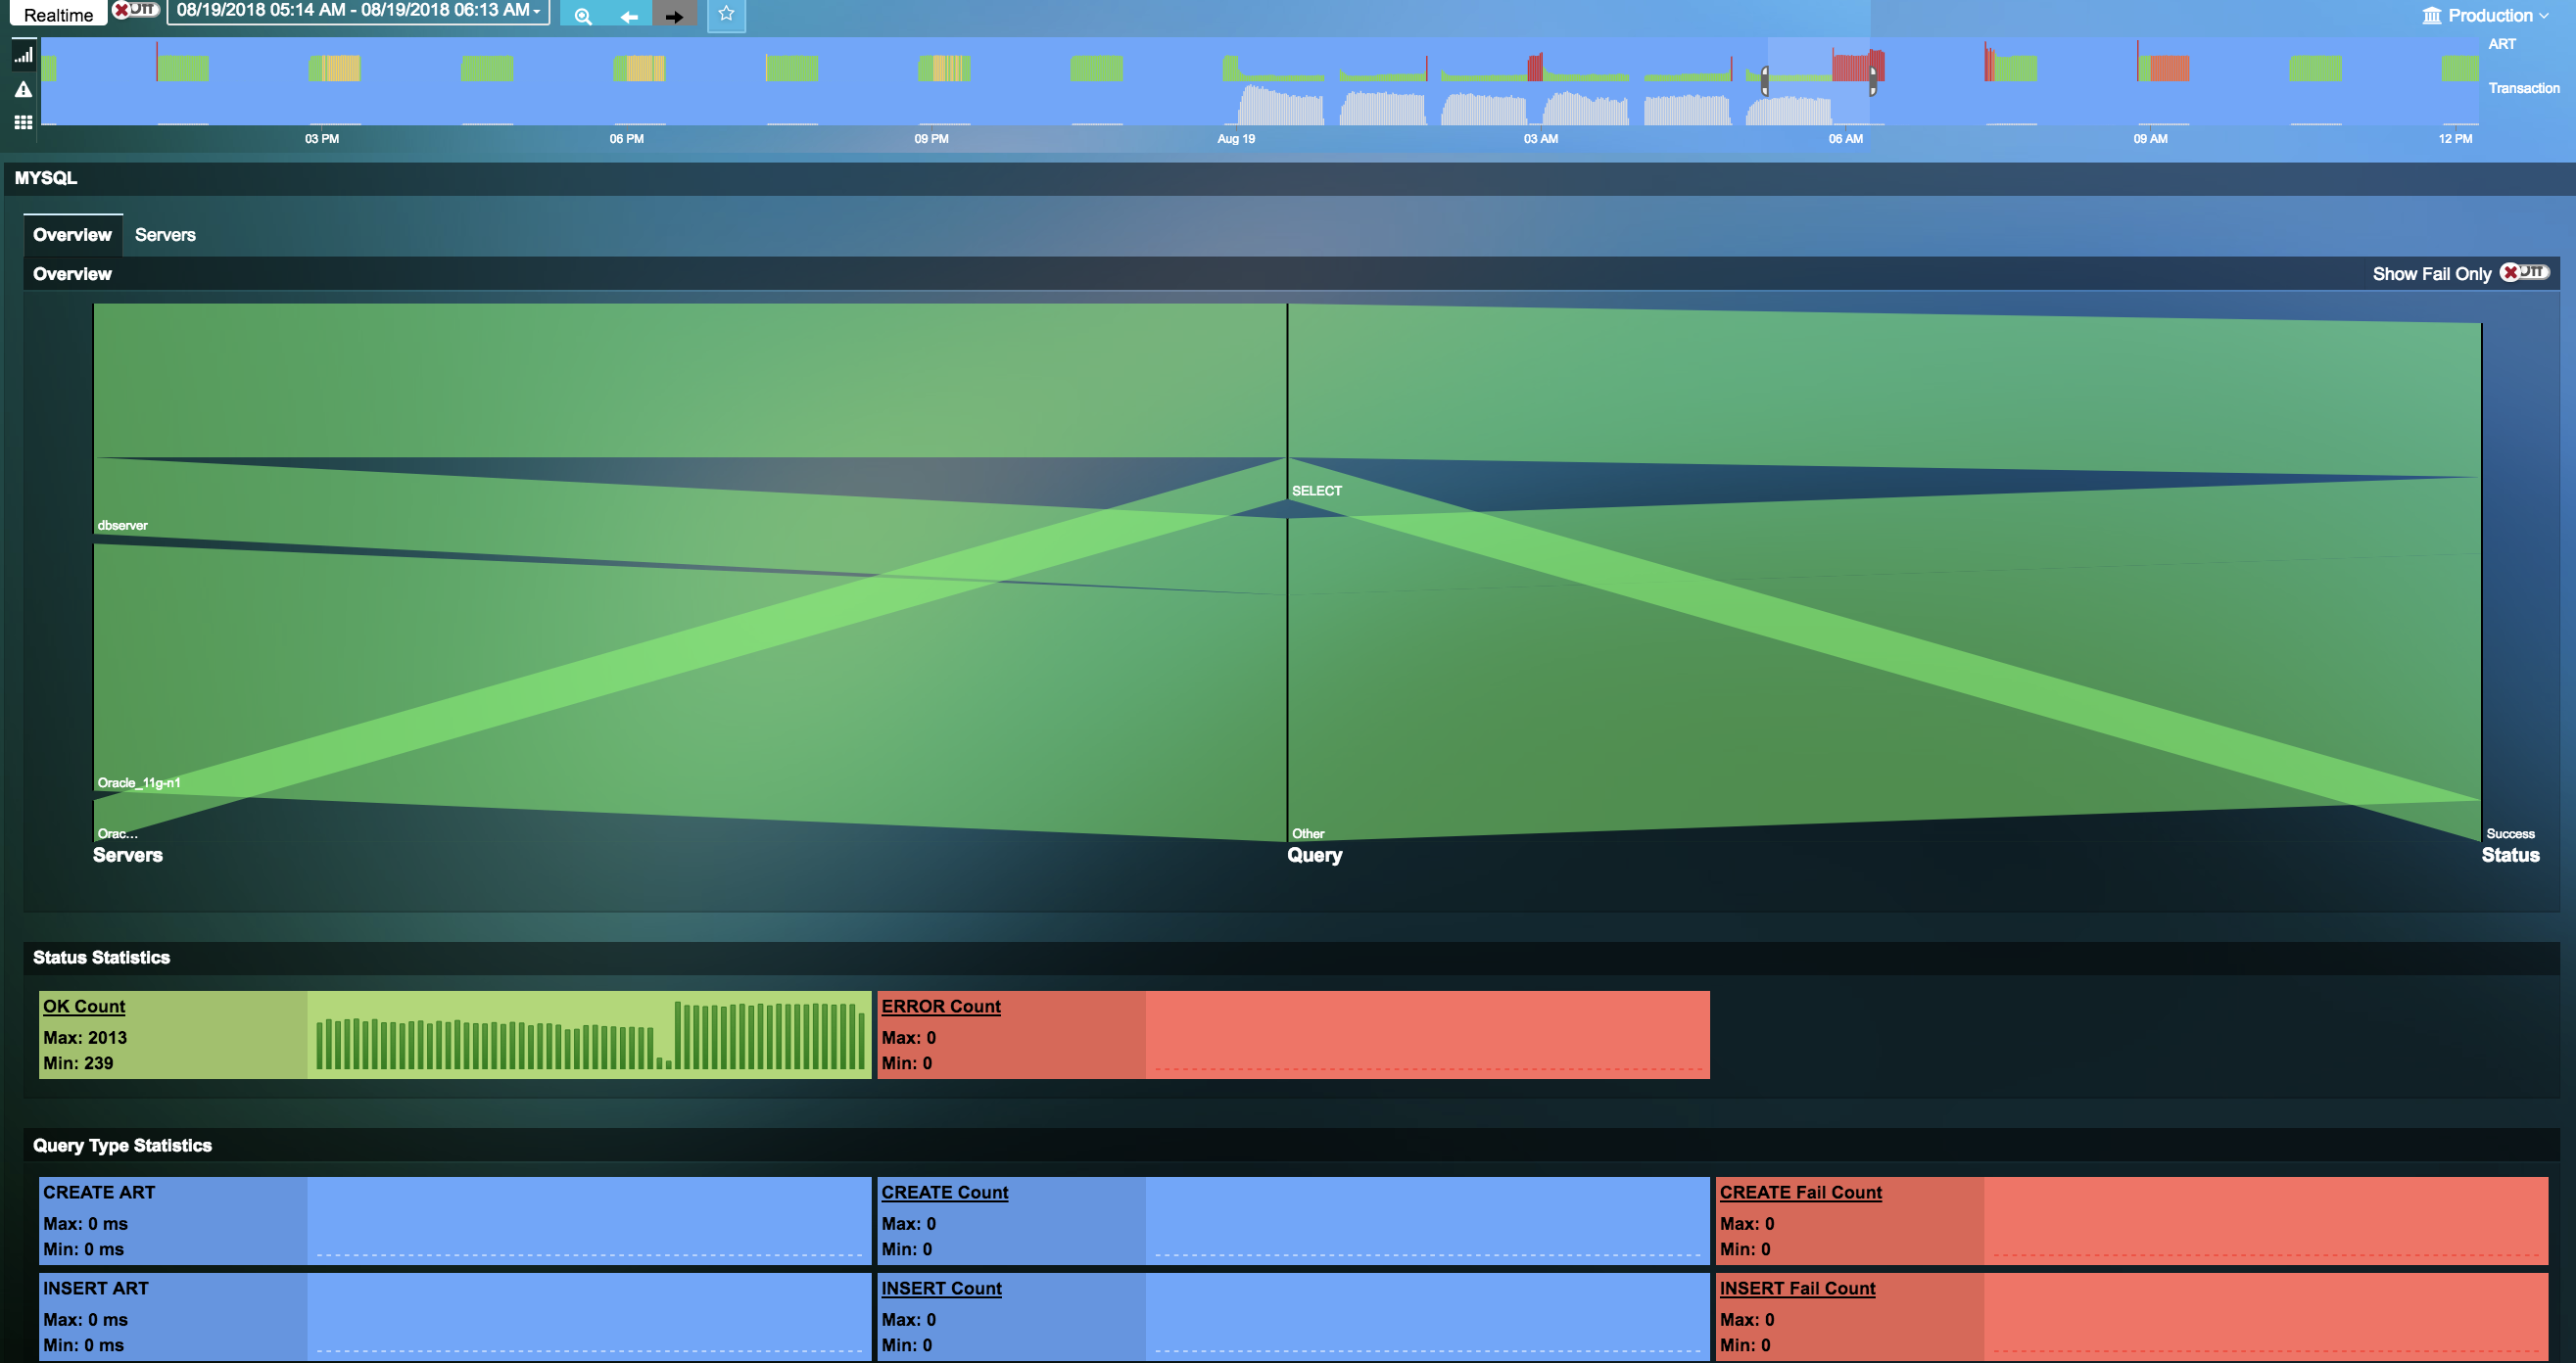
- Uila provides deep insights into web and database applications (MS-SQL, PostgreSQL, DNS, HTTP, MySQL and Oracle) to allow for the issues to be narrowed down and mitigated.
- Detailed Query and Network Statistics –ART, queries (GET, POST, HEAD) and network related transactions & Status code statistics –number of status code requests and responses collected per minute.
- Search Engine for Application Transaction Metadata.
Eliminate pain points within the Compute Infrastructure
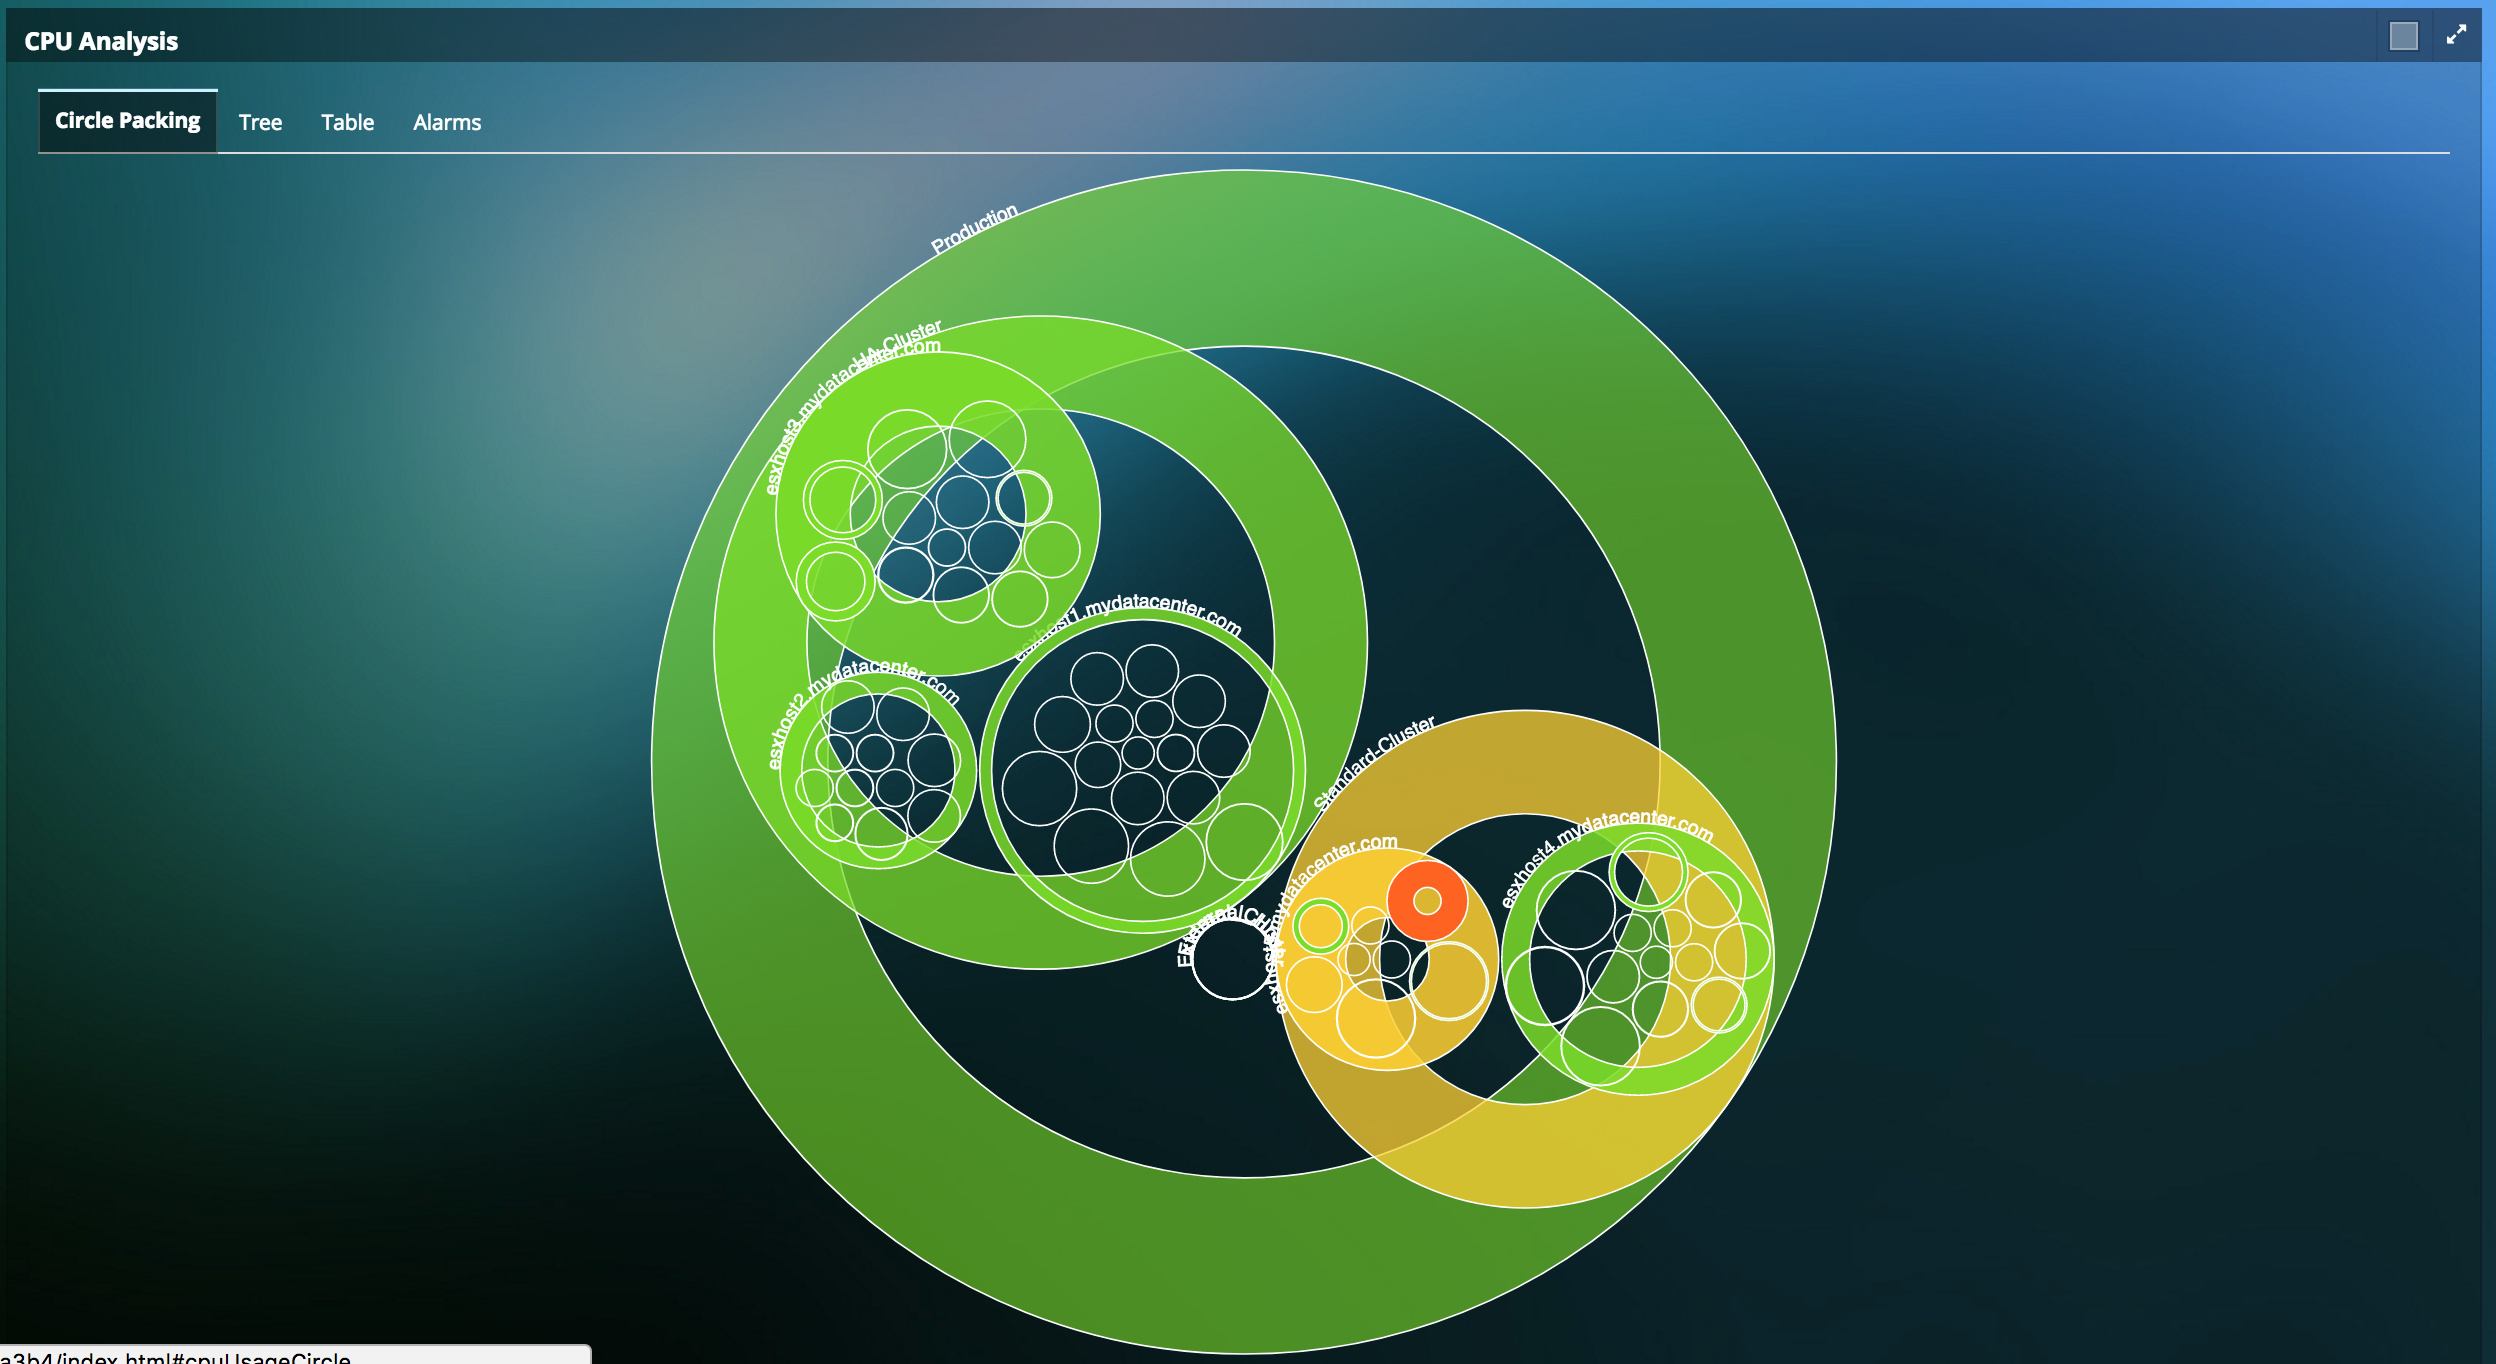
- Visualize how compute performance impacts application performance by measuring metrics such as CPU swap wait, CPU Ready, Utilization and tie this to the Application Response Time.
- Visualize performance of all memory arrays in your hosts with respect to the infrastructure currently running in your data center. Get up-to-date information on memory usage, swap rate, swap wait times, etc.
- Detailed insights into processes using Compute resources.
- Guidance into solving under- and over-provisioned resource challenges.
- Visualize how compute performance impacts application performance by measuring metrics such as CPU swap wait, CPU Ready, Utilization and tie this to the Application Response Time.
- Visualize performance of all memory arrays in your hosts with respect to the infrastructure currently running in your data center. Get up-to-date information on memory usage, swap rate, swap wait times, etc.
- Detailed insights into processes using Compute resources.
End-User Behavior Analytics
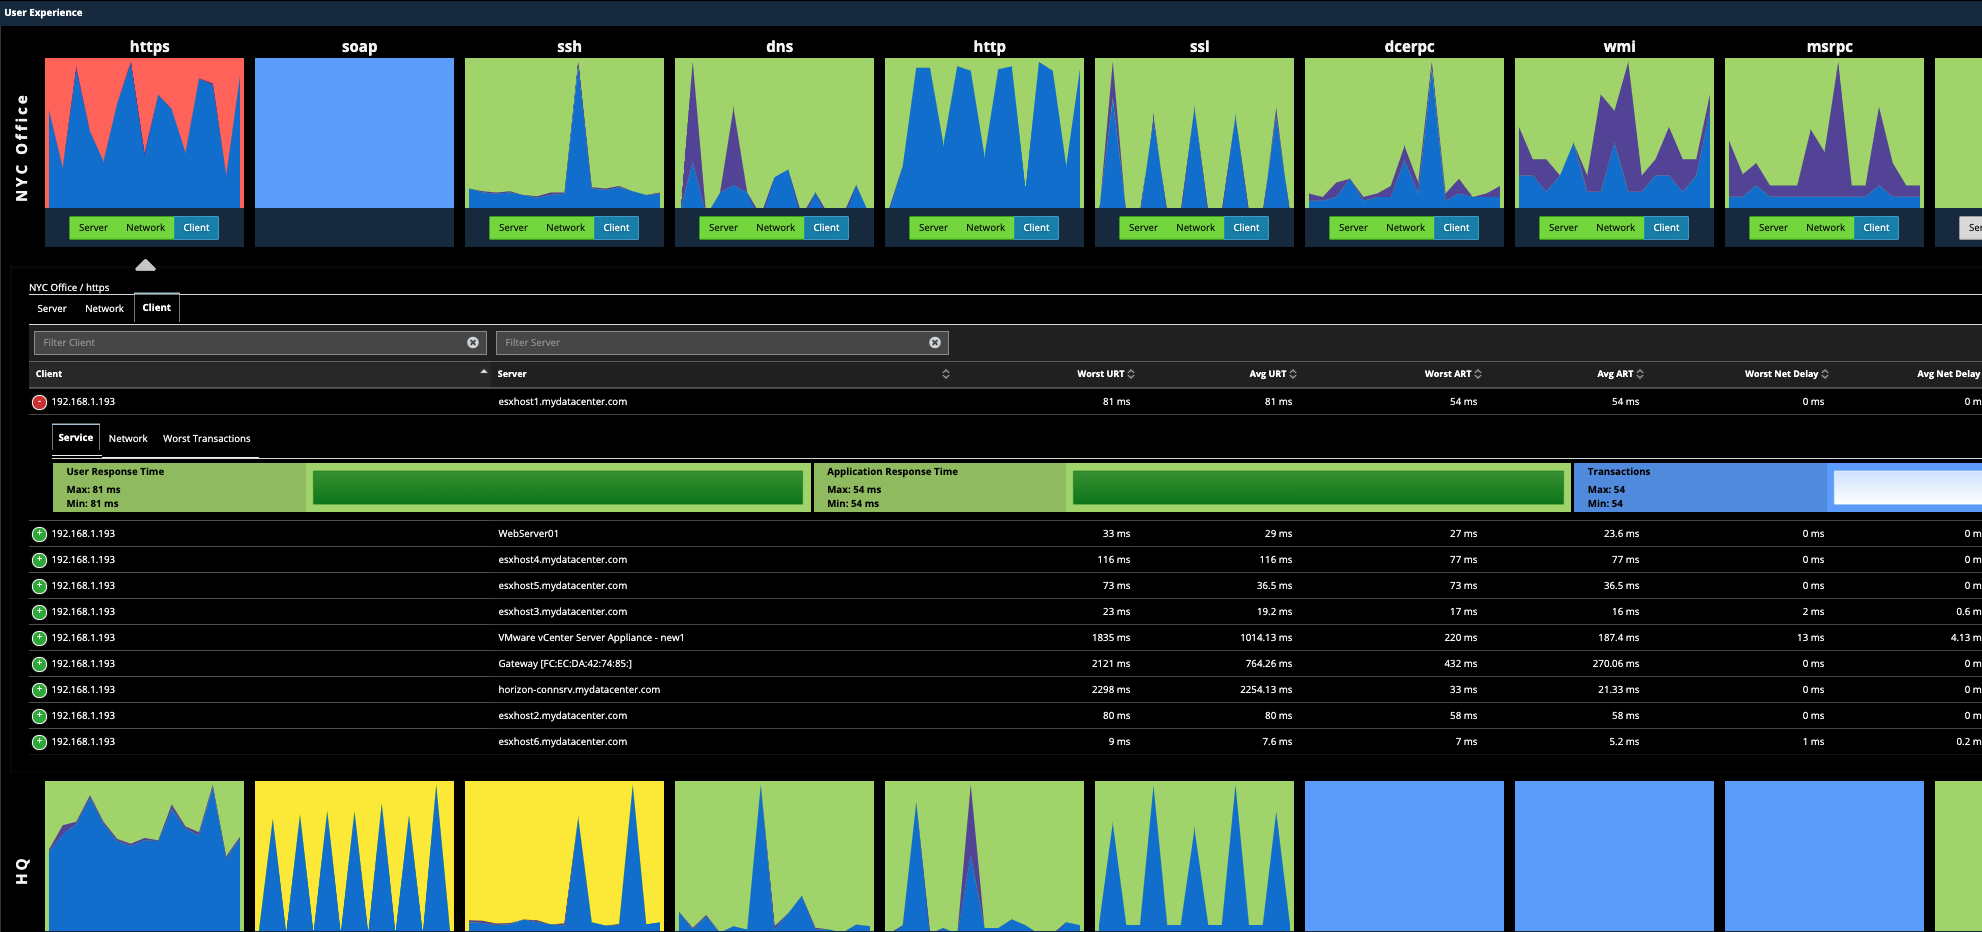
- End user response time tracking proactively alerts IT to service degradation from the user's perspective before user and revenue impact.
- Response time analysis breaks down delays by the server, network, storage, application and clients.
- Site-by-site and client-by-client analysis isolates and correlates user issues to the real root cause, thus speeding up troubleshooting time.
Resources
-
Multinational Telecommunications company Success StorySuccess Story for a top US-based Multinational Telecommunications Company where Uila helped their R & D division shorten the development cycle and reduce MTTR for issues by over 40%.
-
Infrastructure Performance Monitoring with UilaQuick product video on how to use Uila for Infrastructure Performance Monitoring
-
Application Performance Monitoring with UilaQuick product video on how to use Uila for Application Performance Monitoring.
Ready to begin your Monitoring Journey with Uila?
Start a 21-day Free Trial Now
Request Trial


