There is a lengthy list of virtualization performance and capacity tools that monitor CPU, memory, storage, and network. However, when they say that they monitor the “network”, what they really do is to go to vCenter and pull basic network statistics such as bytes in/out, packets in/out, and perhaps error counts on physical and virtual interfaces. While there is some value in knowing the volume of network traffic going in and out, it becomes obvious to any virtualization admin once they have their first capacity troubleshooting issue that basic network statistics like these aren’t very helpful. For example, let’s say that a host adaptor has a large increase in network traffic going out. So what? Is that a problem? Let’s say that you can tell from your tool that it’s “abnormal”, then what? You can’t tell WHAT that traffic is, who is talking to who, what protocols they are using, and if it is causing latency for other traffic on the same host.
In other words, most virtualization monitoring tools do little to identify and help you to resolve problems in the virtual network.
To further exacerbate this problem, more and more companies are moving toward 100% virtualization with little to no insight into what’s happening on the virtual network. In most cases, many in the infrastructure group figure that if they just give the network a ton of bandwidth (like 10Gig Ethernet) that “everything will be okay”.
What You Need In a VIrtual Network Monitoring and Troubleshooting Tool
Network problems are REAL and they cause application downtime (or slowness) in your company’s most critical applications. Basic network stats aren’t enough to identify and resolve virtual network problems.
What you really need to know about the virtual network is:
- Who is talking to who
- What they are talking about (the ports and protocols in use)
- Who is using the virtual network the most
- If any VMs are experiencing an unusual amount of virtual network latency
- If there is latency on the virtual network, where the network bottleneck is (at the physical switch, host network adaptor, virtual switch, or virtual NIC)
- What action you need to take to alleviate the latency and remediate the bottleneck, returning application performance to where it needs to be
Introducing the New Uila Virtual Network Performance and Troubleshooting Tool In Hawaiian, Uila means “lightning” or “electricity” and it’s pronounced “wee-lah”. Recently out of stealth mode, Uila just announced their new virtual network performance and troubleshooting tool to the public. The great thing is that they are offering their tool in beta form, completely free. After testing the tool myself and seeing it in action, I’ve found that Uila didn’t create a low-end free tool. The Uila virtual network performance and troubleshooting tool is one of the most advanced virtual network tools I have ever seen and with one of the most impressive user interfaces I have seen.
Uila is run by the two co-founders of AirMagnet, Dean Au and Chia-Chee Kuan, which they sold to Fluke Networks in 2009. With the launch of their new company and product, they’ve brought their years network analysis experience to bear on the virtual network. Dean likes to say “follow the red” and you’ll be able to find the solution to any problem in the virtual network, using Uila. What he means is that, when their tool identifies any current or future virtual network bottlenecks, you’ll see a red indicator and by clicking on that, you’ll drill down deeper into the topology, and within 2-3 clicks you’ll very quickly be able to identify the true root cause of the virtual network bottleneck — AND get a recommendation on how to remediate it.
For example…
Using the Uila Virtual Network Topology Map
One of my favorite features in Uila is their automatically created virtual network topology map. Here’s why- let’s say that you just started in a new company and want to understand what applications are out in the virtual infrastructure and what their relationships are. You could walk around to the offices of the application owners, talk to the network admin, and maybe CIO and still not have accurate information on what applications are out there and how they work. More importantly, what happens when those applications STOP working? Where is the bottleneck? You need that virtual network relationship mapping to know the dependencies for troubleshooting performance issues, for disaster recovery planning, and just for basic understanding of the environment.
So the #1 use case for the automatically created network topology mapping is for troubleshooting. Having a high level view of who is talking to who on the virtual network, what protocols they are using (which typically tells you the application type), what the latency is between each of them. If there is a performance bottleneck in the virtual network, you can “follow the red” down to quickly identify the root cause.
Other uses for the network topology mapping are disaster recovery planning (for example, what VMs would be needed to run our tier 1 application at a DR site?) and security monitoring (for example, what ports do the applications on that VM require?)
Solving the Top 5 Virtual Infrastructure Problems with Uila
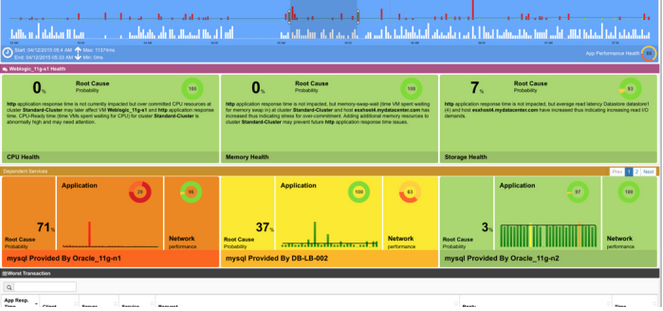
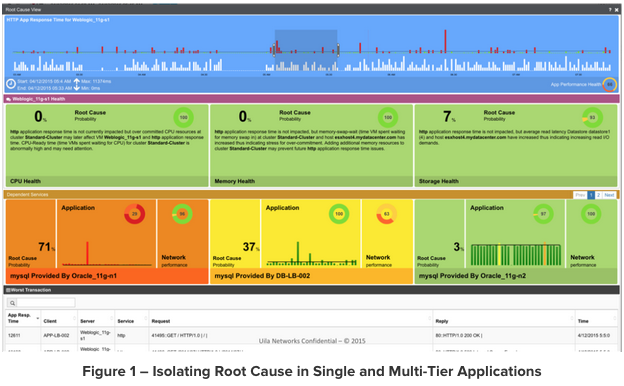
Recently I wrote and whitepaper and conducted a live event where Uila demonstrated how their tool could help to solve some of the most common vSphere infrastructure problems. Uila is very strong when it comes to application performance analysis across the virtual network. Here’s Uila identifying application performance and latency:
Uila demonstrated how it identified and help to solve problems list:
- Isolating Root Cause in Single and Multi-Tier Applications
- Preventing Network Latency for Critical Applications
- Identifying vCPU Over and Under-Provisioning
- Troubleshooting Storage I/O Contention and I/O Latency for Tier-1 Applications
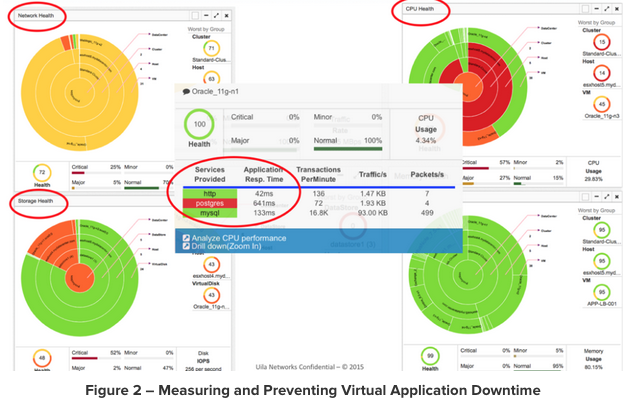
- Measuring and Preventing Virtual Application Downtime
Who Needs the Uila VIrtual Network Performance and Troubleshooting Tool?
The short answer to this question is – everyone who has a vSphere infrastructure. Sooner or later you will have a virtual network bottleneck that you have to troubleshoot and, when you do, you’ll wish that you had the Uila tool in place. However, there are specific virtual infrastructure use cases where Uila’s tool is an absolute requirement, from day one. Those are:
- Complex environments – virtual infrastructures that are large and have multi-tiered applications will run into virtual network bottlenecks faster than smaller and simpler environments
- Critical applications – if you have applications that absolutely cannot go down then you must have tools in place to prevent those outages before they occur. This is of course especially true for companies that have latency-sensitive applications.
- VDI – virtual desktop infrastructures really cover all of the above two points. VDI is complex, critical, and sensitive to latency. For that reason, every VDI environment needs a virtual network monitoring and troubleshooting tool in place from day one. If you think about it, just about every company has “critical applications”, to some degree, just about every virtual infrastructure is a “complex environment”, and no one wants their applications to suffer from latency.
How do you get started with Uila’s Virtual Network Monitoring and Troubleshooting Tool?
Thankfully, Uila’s tool has been created in a virtual appliance so there’s no OS to license and nothing to install. You can register to download Uila at the link below and, shortly you’ll be contacted by a Uila representative with a download link and instructions on how to perform the deployment in your vSphere infrastructure. The deployment is a simple vApp deployment that takes only minutes and configuring the VM to monitor the virtual network is easy to do as well.
To register to download the free trial of Uila, click here.


