Agentless Rollout
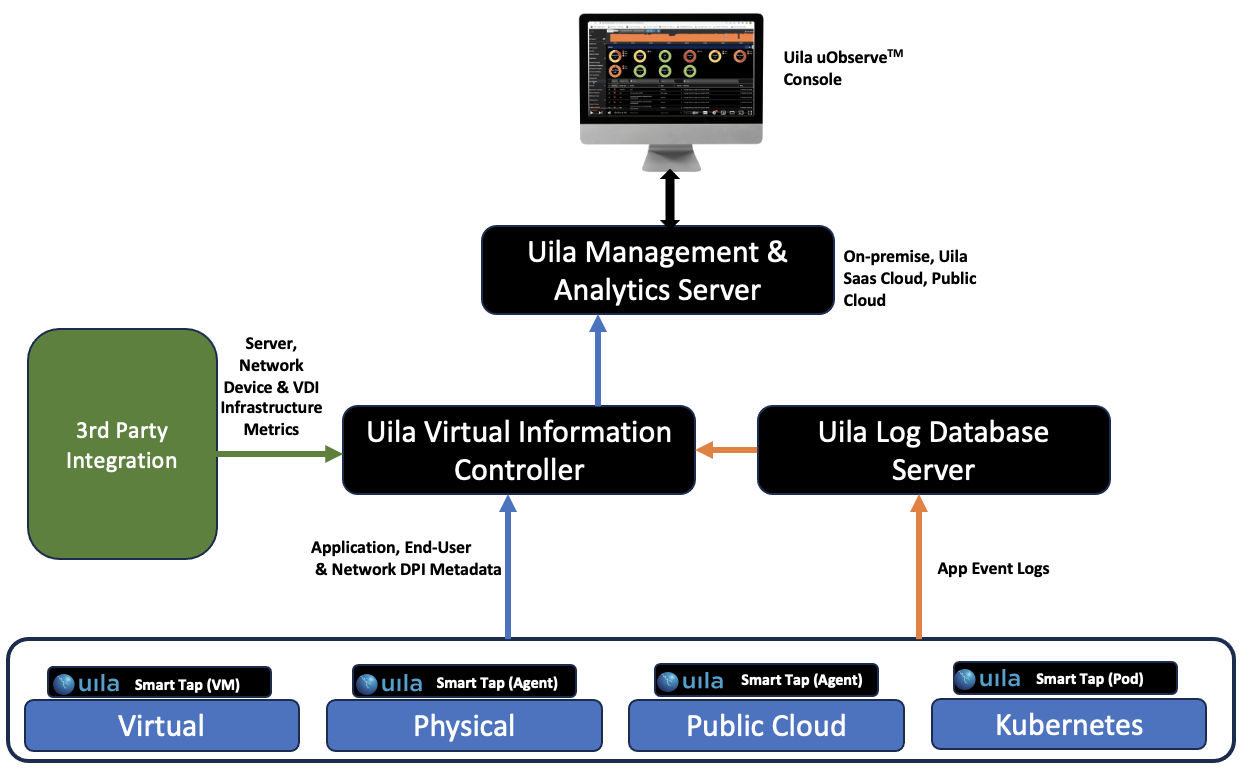
- Fast, Simple and Efficient rollout without the use of any agents.
- No special approvals needed from any application owner.
- Perform Deep Packet Inspection (DPI) and automatically classify over 3,500 applications (web, database, Saas, web conferencing, websites, healthcare, financial, etc.) running in your VDI environment.
- Monitor any 3rd party application or Saas applications with ease.
Automated VDI Components Discovery
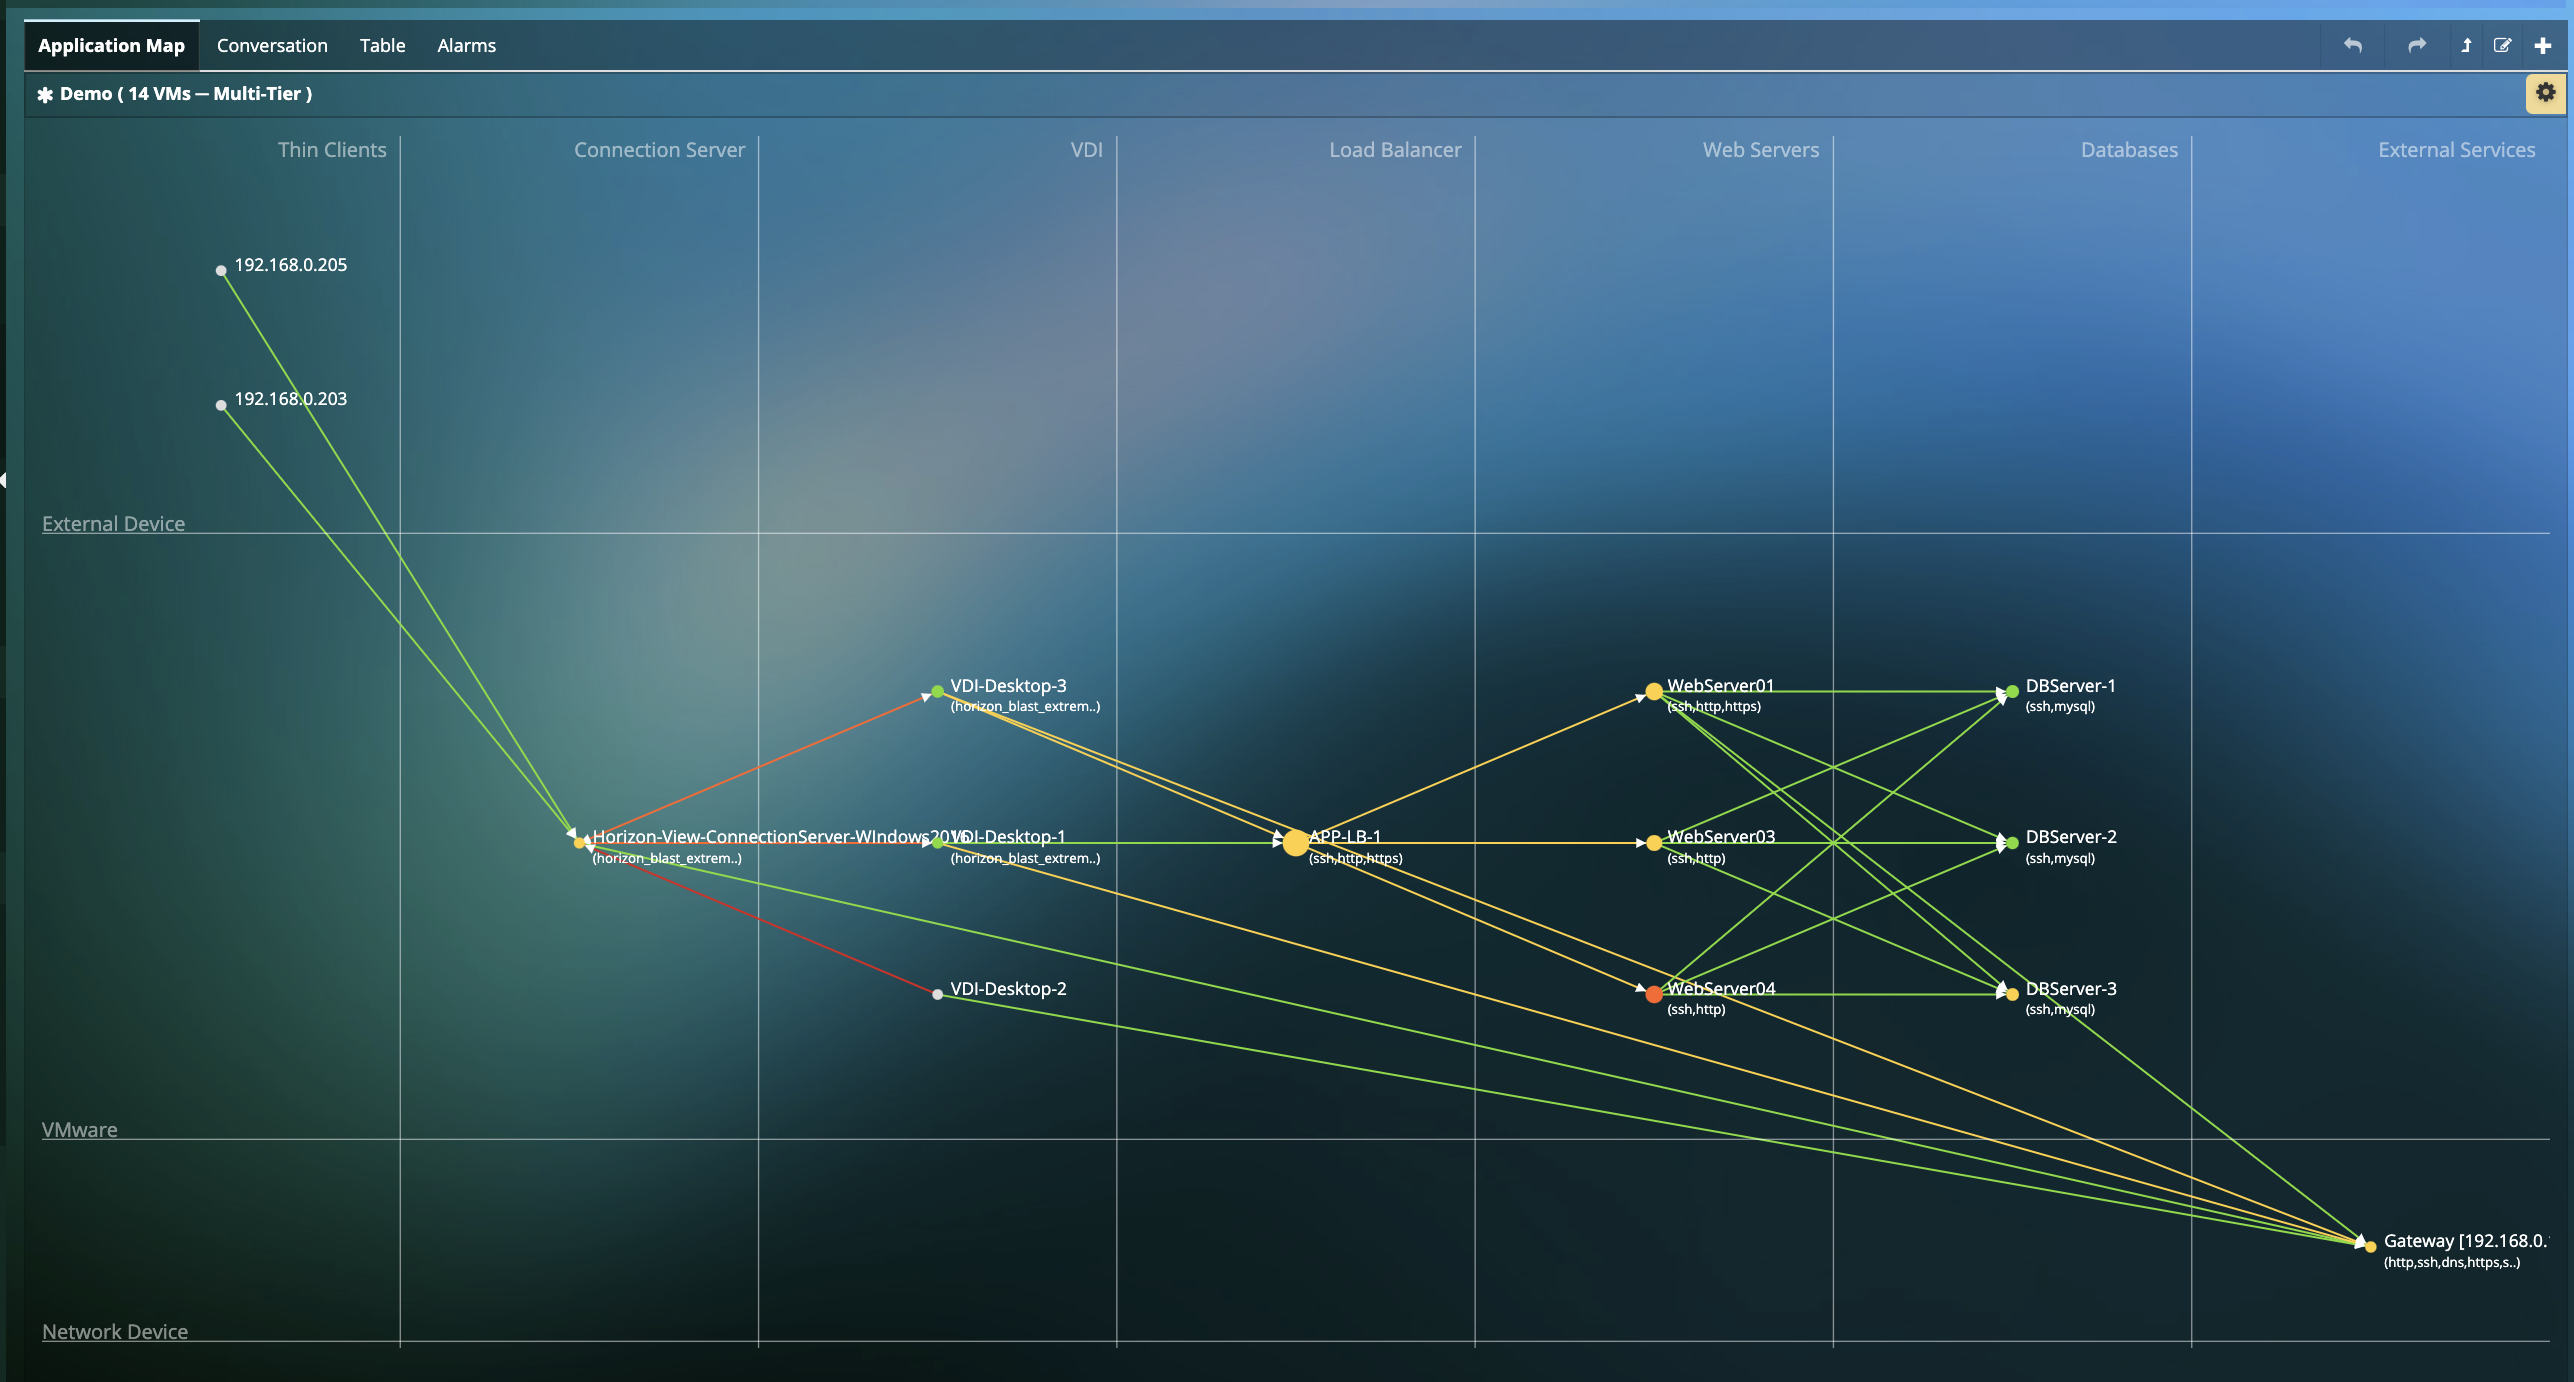
- Reduced time to value with Automated discovery of VDI Components (end-to-end from user clients to virtual desktops to backend application and connection servers) and all interdependencies for VMware Horizon and Citrix deployments.
- Troubleshoot issues proactively directly from the Dependency Map down to the Application, Network or Infrastructure.
- No manual updates or interventions needed to build the Dependency mapping. Install Uila, and we will build the maps automatically with NO code changes needed.
- Identify challenges with individual applications running for every VDI user and virtual desktop.
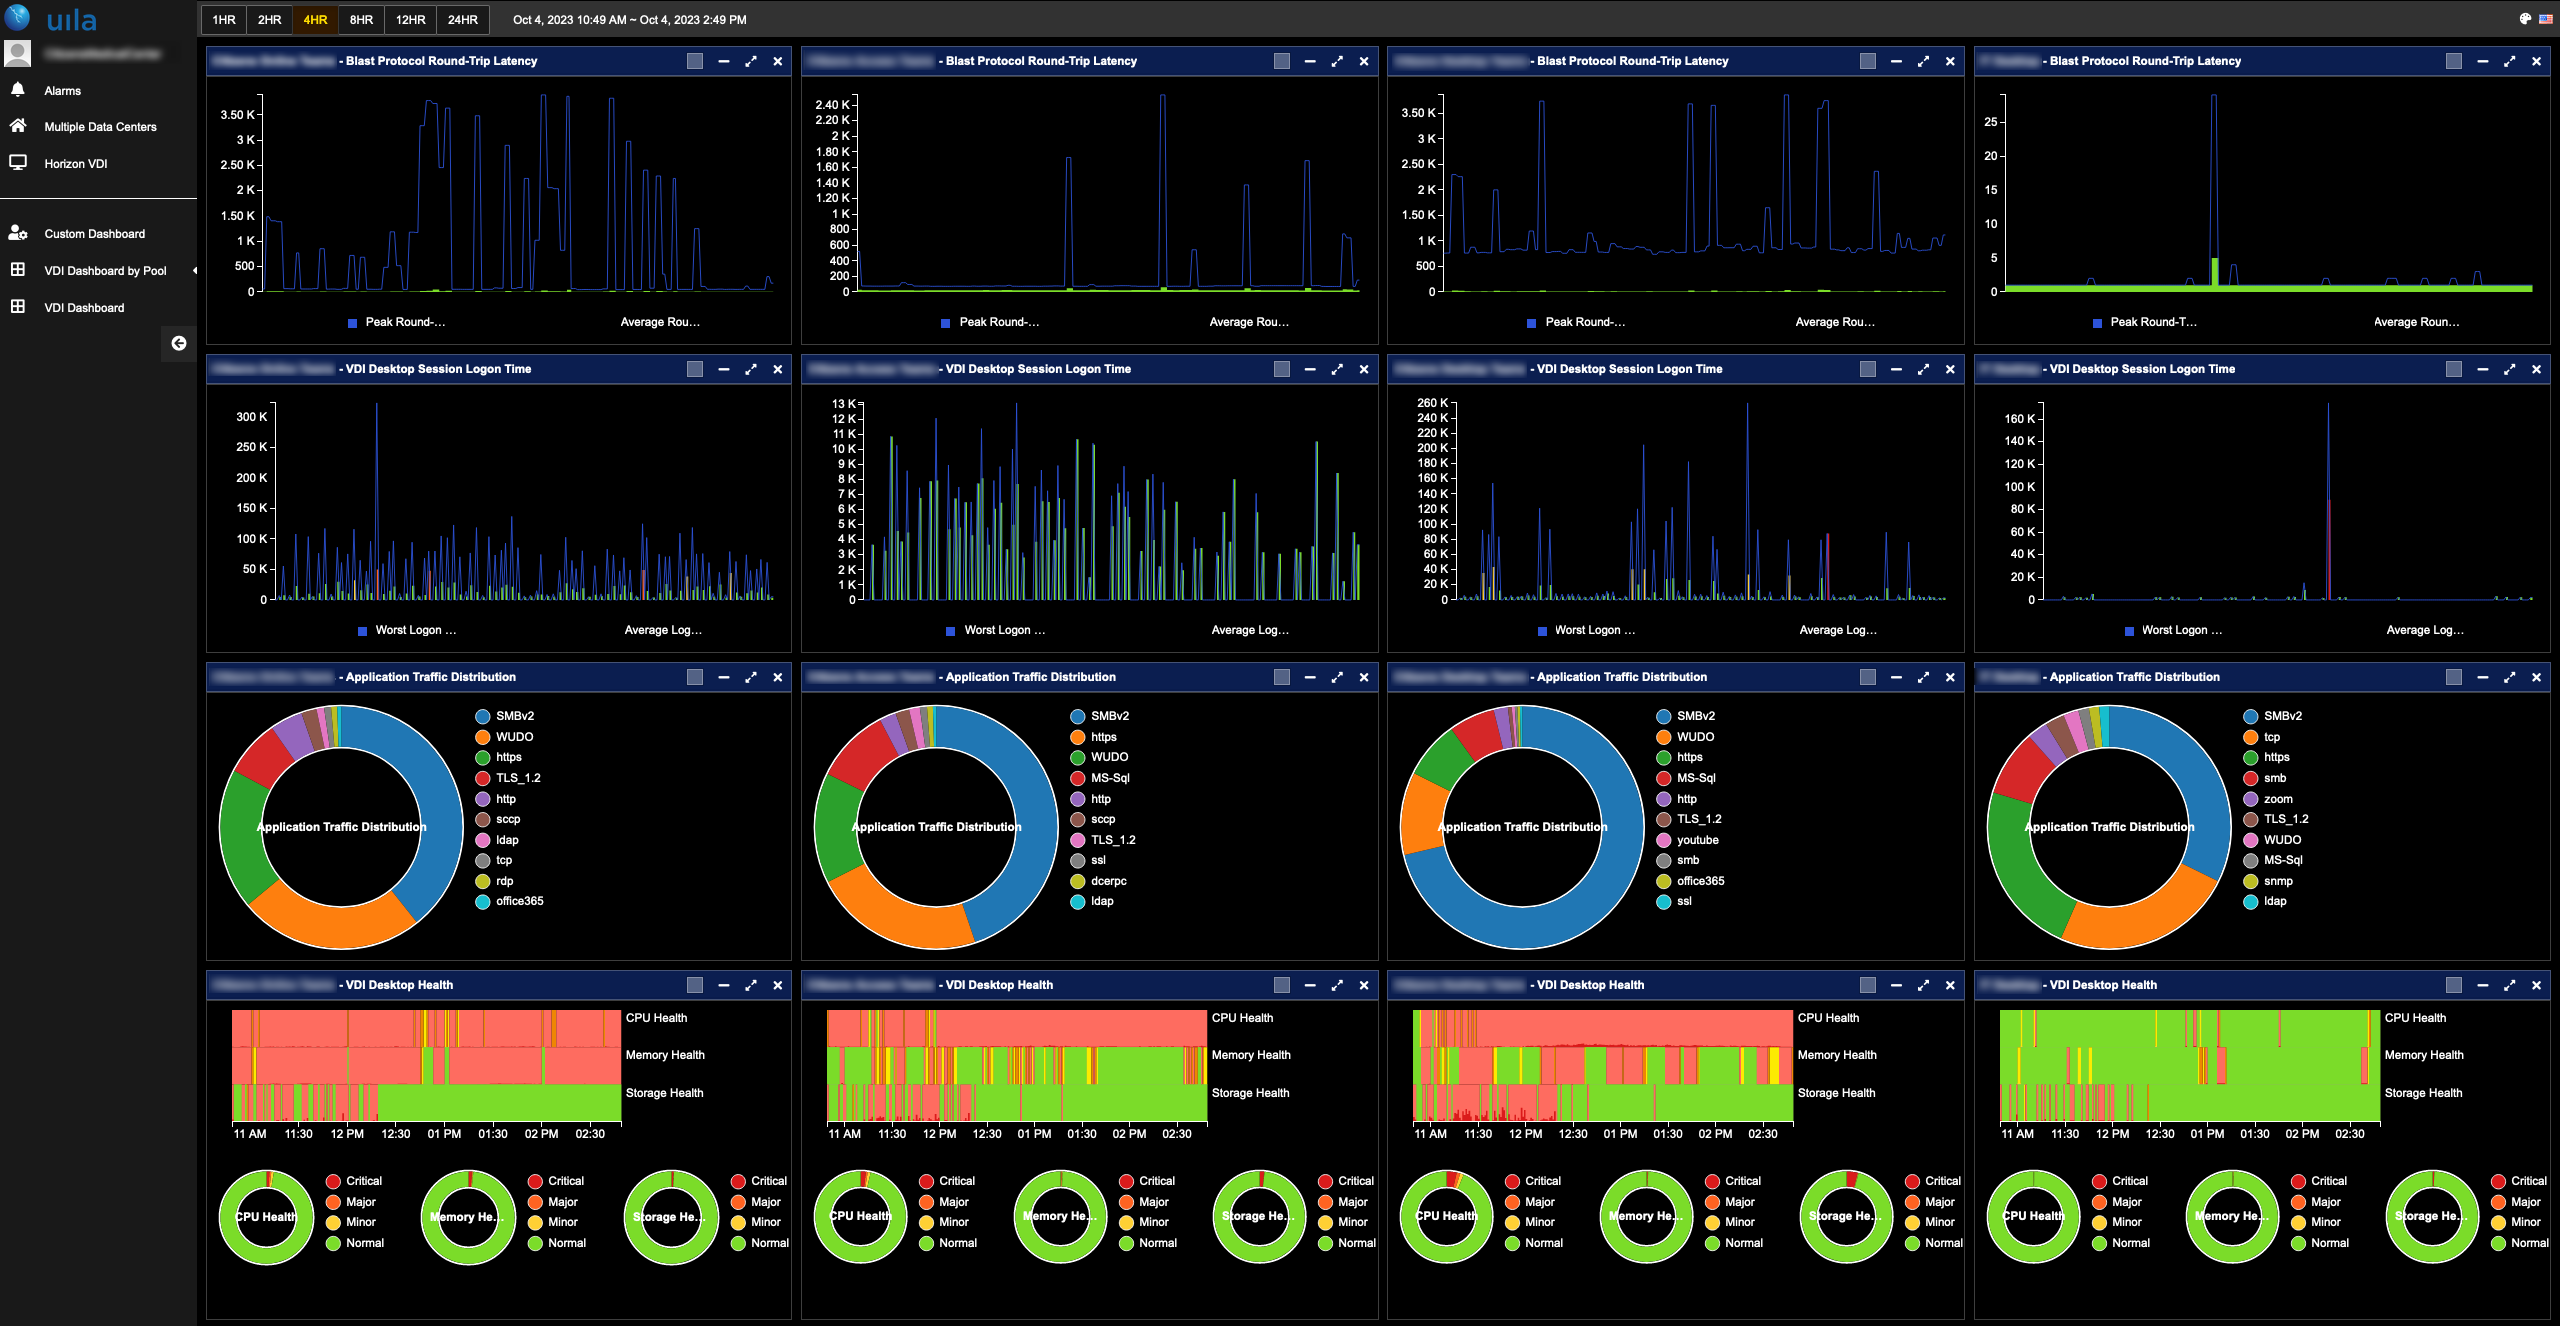
Troubleshoot at High Velocity with Root-Cause Analysis
.png)
- Monitor application performance and perform rapid root-cause analysis and reduce MTTR from days to minutes.
- Utilize continuous Machine Learning (ML) & Behavior Learning algorithms to identify anomalies from performance baselines instead of manual guesstimates, to provide unprecedented level of accuracy.
- Identify if VDI issues are due to the Infrastructure resources, Virtual or Physical Network, Application transaction issues, Authorization & Authentication issues, etc.
- Real-time or time travel in the past to detect and solve intermittent issues.
- Create customized VDI Dashboard for overall health visibiliy, and for comparing performance across pools, sites, etc.
VMware Horizon User Session Analysis
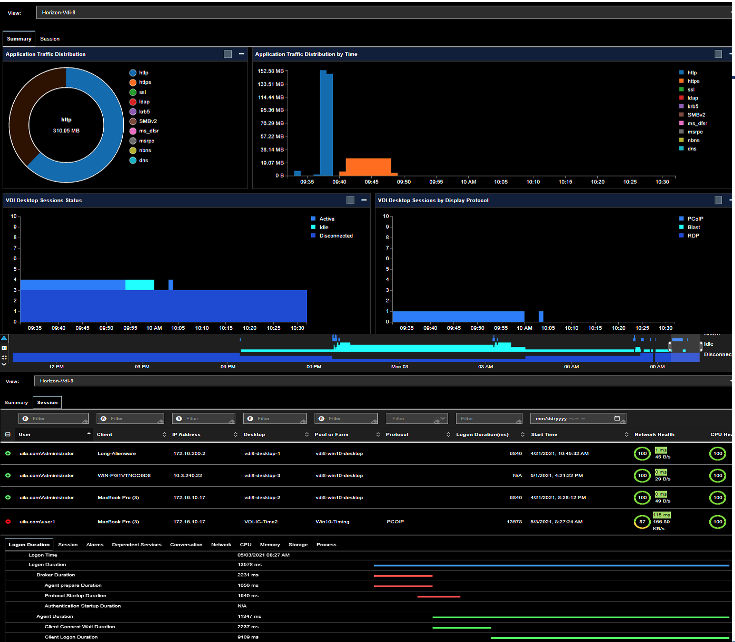
- Visualize session data for your entire VDI deployment or customize view for your Pools, Pods or Sites.
- Insights into detailed user sessions for VMware Horizon deployments. Visualize Active, idle and disconnected sessions.
- Visualize username, associated virtual desktop VM, session start time, pool or farm information, etc.
- Measure time for every stage in the logon process like broker duration, agent duration, app launch duration, etc. and isolate issues leading to failed or slow logons.
- Visualization of Blast Extreme and PCOIP RX and TX Packet Loss, Round-Trip Time, User session latency, bandwidth, etc.
- Insights into Application traffic from VDI desktop as a client connects to application servers (e.g. Zoom, ERP, Databases, EHR, etc.)
- Detailed information on the Windows Desktop Processes.
Nvidia GPU Monitoring
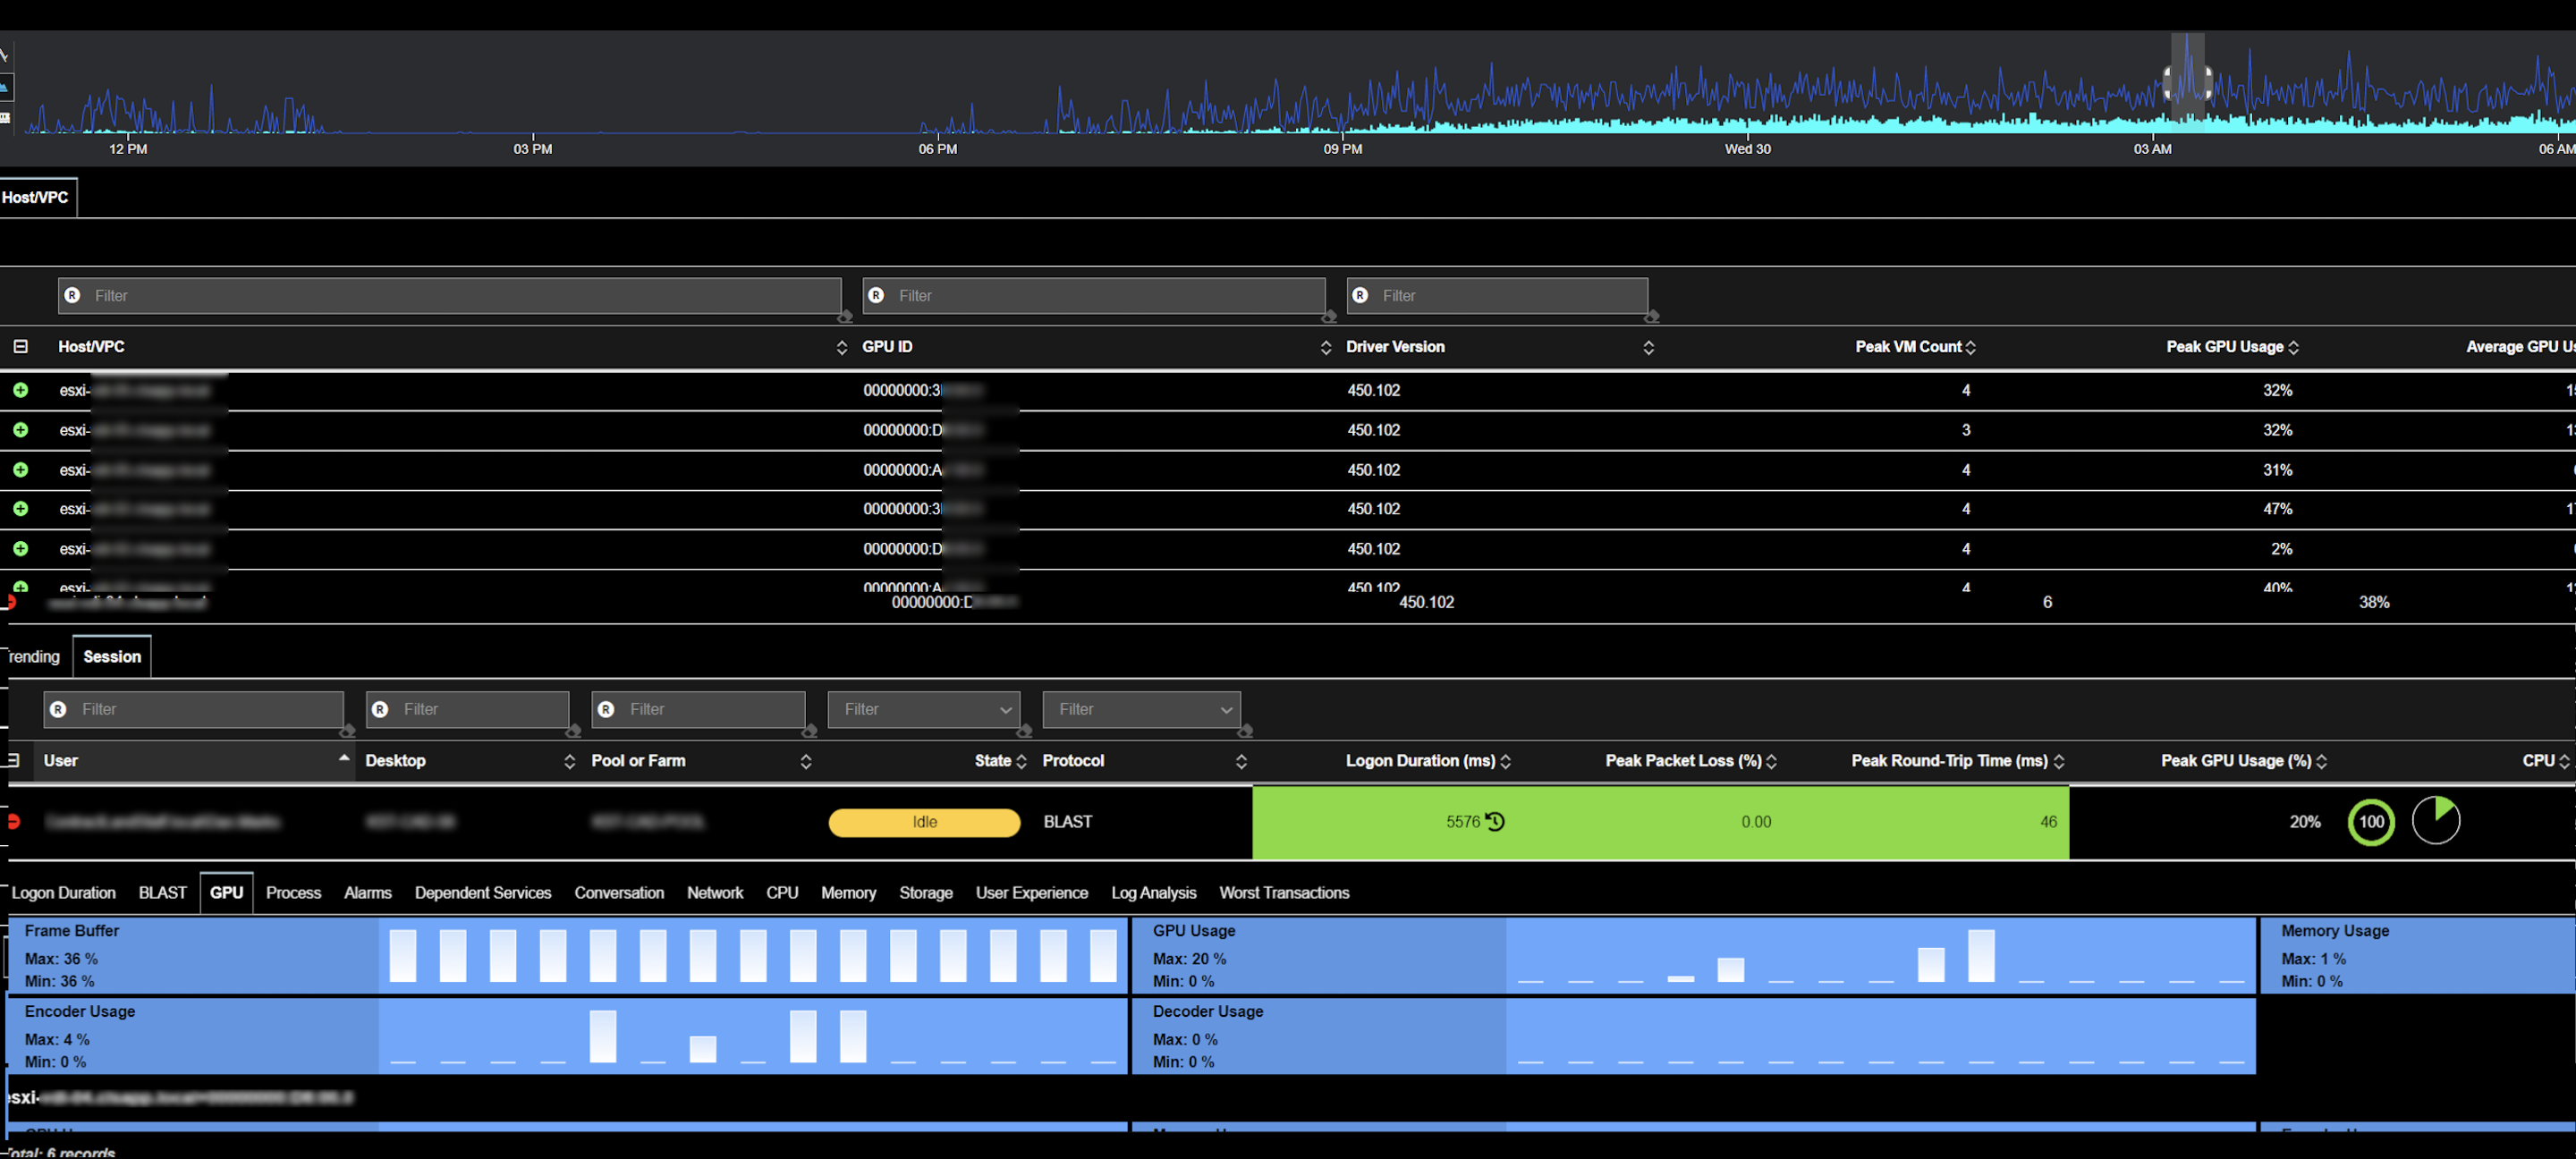
- Intelligent NVIDIA GPU metrics using the NVIDIA System Management Interface (NVSMI) to allow desktops teams to provide the maximized performance for GPU-enabled virtual desktops.
- Critical GPU insights like VM-level Peak GPU usage, frame buffer, GPU decoder/encoder usage, memory usage, etc. for the individual user sessions.
- GPU host level metrics like GPU ID, driver version, peak VM counts, peak/average GPU & memory usage.
- User-friendly GPU usage report to be delivered at a time of their convenience.
End-User Behavior Analytics
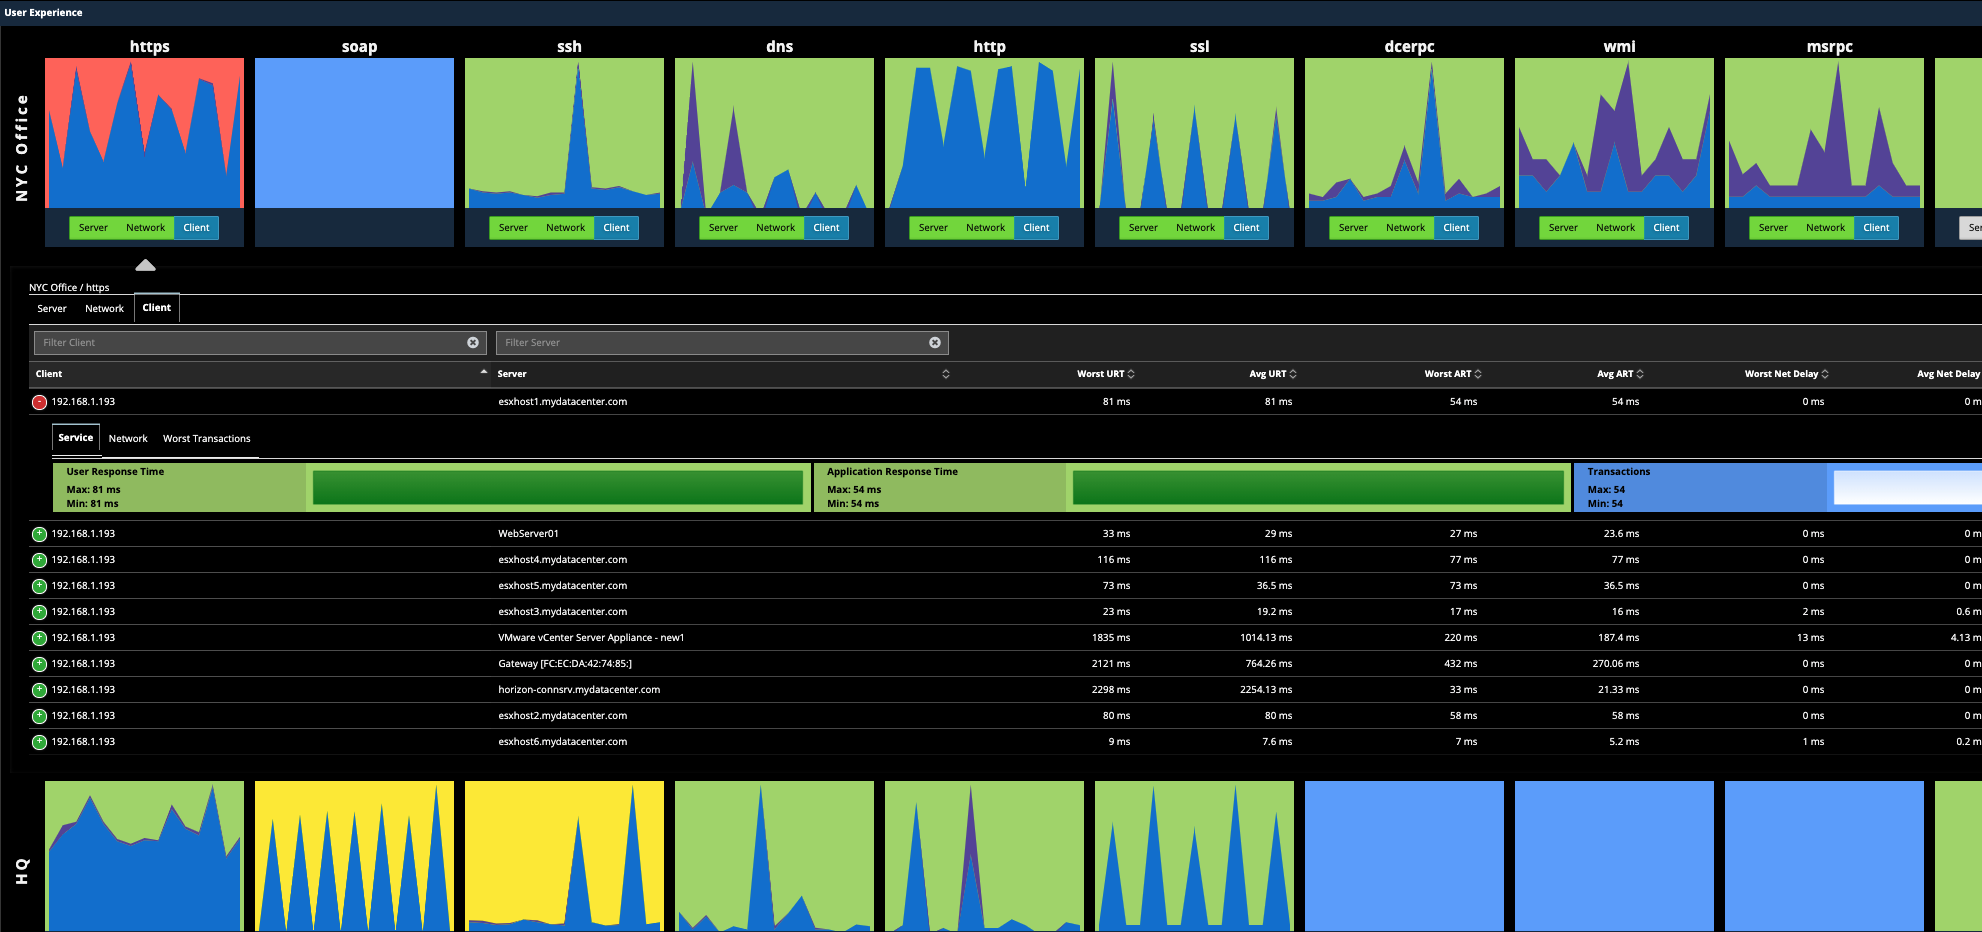
- End-user response time tracking proactively alerts IT to service degradation from the user's perspective before user and revenue impact.
- Response time analysis breaks down delays by the server, WAN network, or the client device.
- Site-by-site and client-by-client analysis isolates and correlates user issues to the real root cause, thus speeding up troubleshooting time.
Pinpoint Storage issues impacting VDI performance
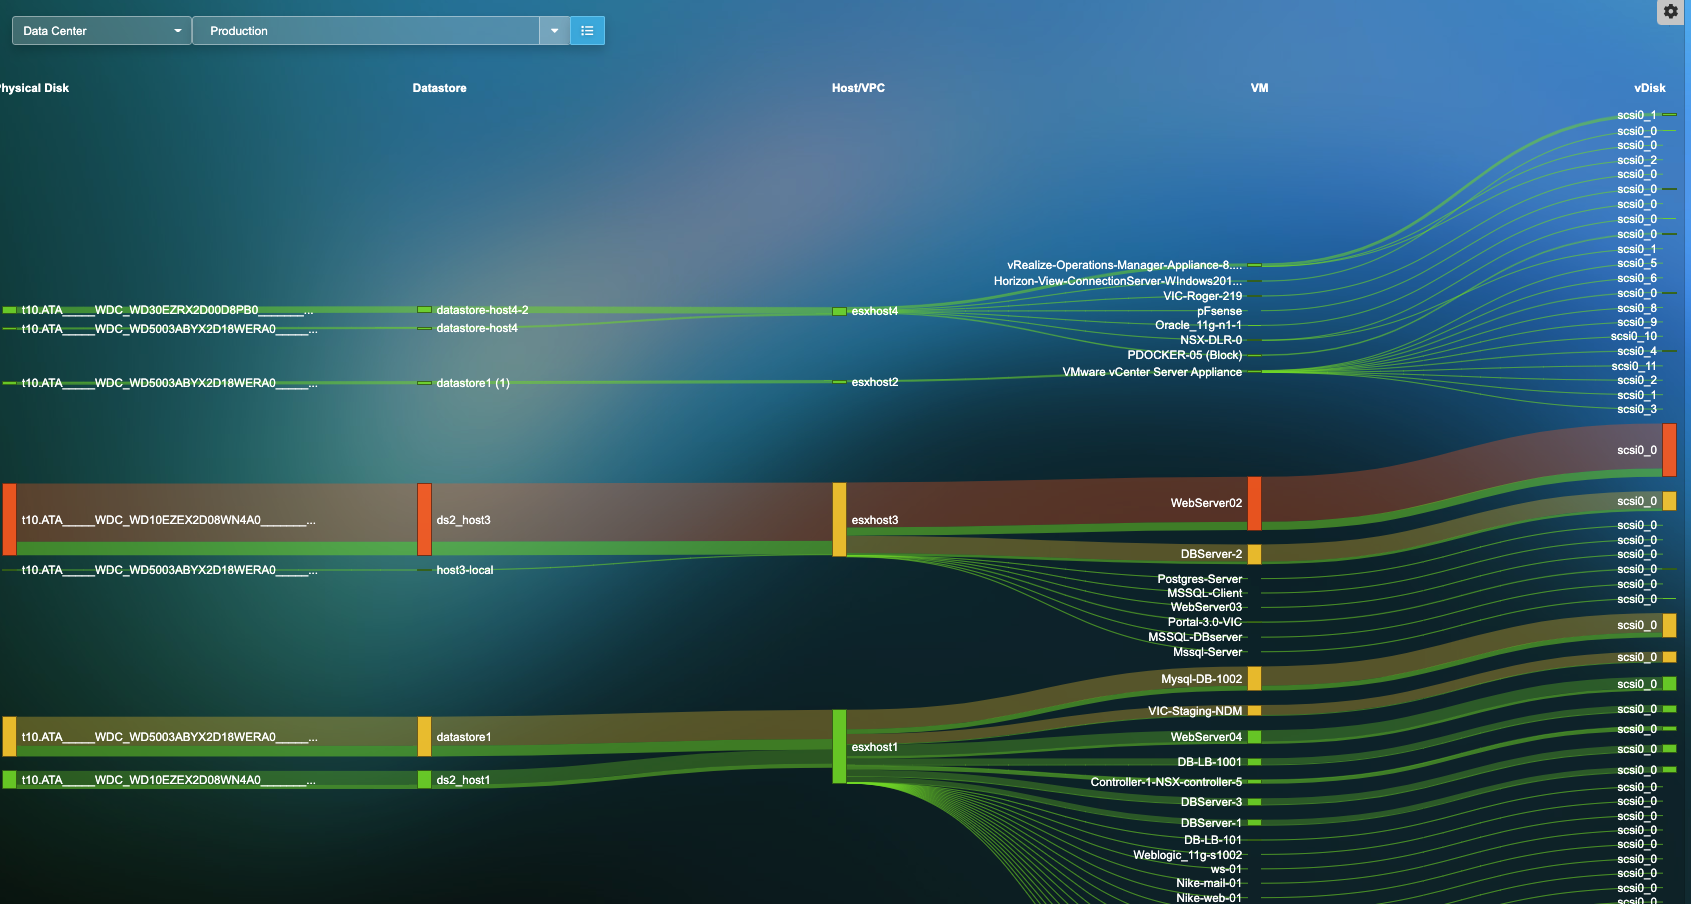
- Monitor Storage performance and isolate issues across multiple vendor’s storage arrays on a 24 x 7 basis.
- Visualize trending performance issues on Read/Write latencies and IOPS across VMs, vDisk and Data Stores.
- Visualize and get automatically alerted on disk capacity challenges impacting VDI performance.
- Simplify capacity planning procedures with insights into storage hotspots.
Visualize Network Traffic issues impacting VDI performance
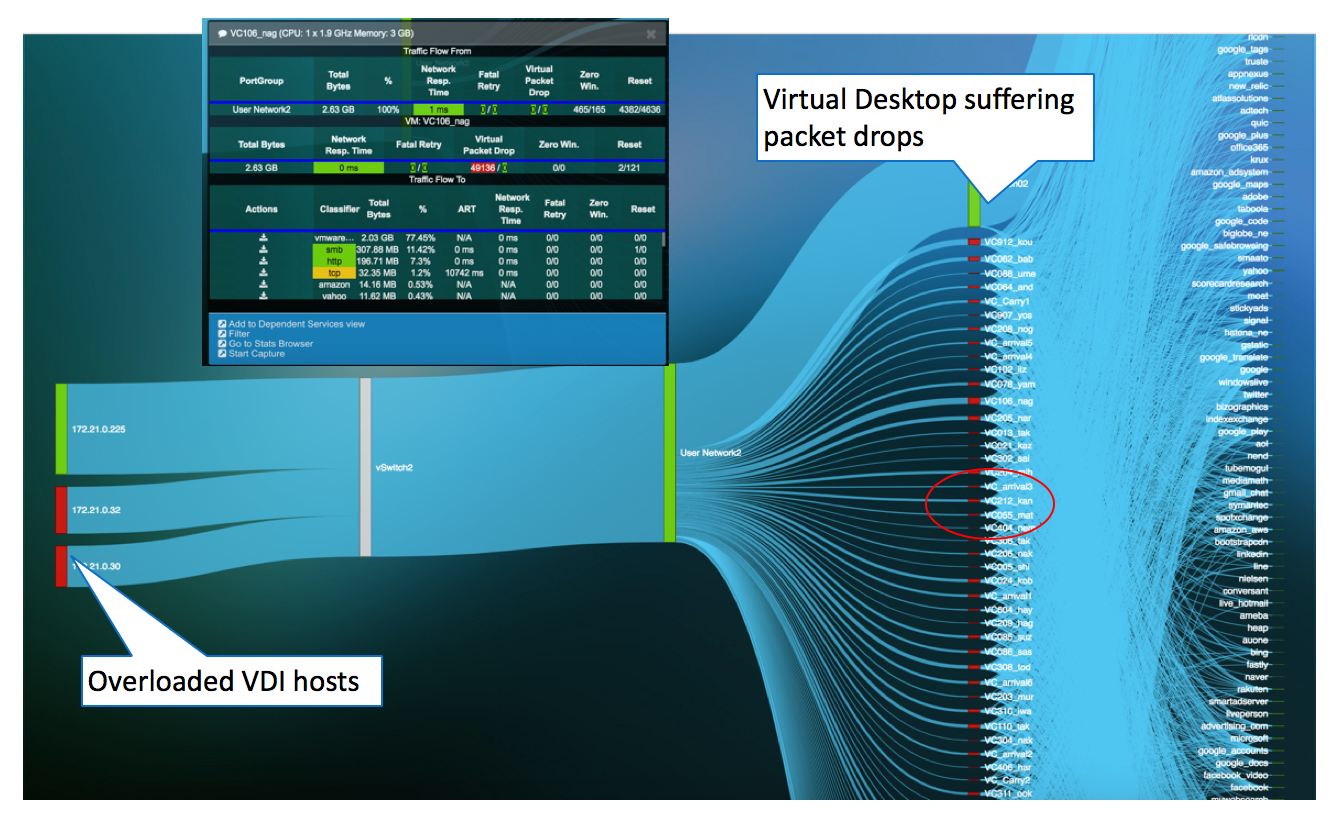
- Visualize how the application network traffic traverses across physical devices, virtual entities & Application Services, to pinpoint network hot spots impacting application performance.
- Review Network Round Trip Time, Traffic Volume, Retries, Packet Drops, Application Response Time for each application.
- Top-down visualization approach from the Application or Business Service to its correlated Infrastructure and Network root cause for faster root cause resolution.
- Isolate issues down to the Server, WAN network or Remote client device for your Remote workforce.
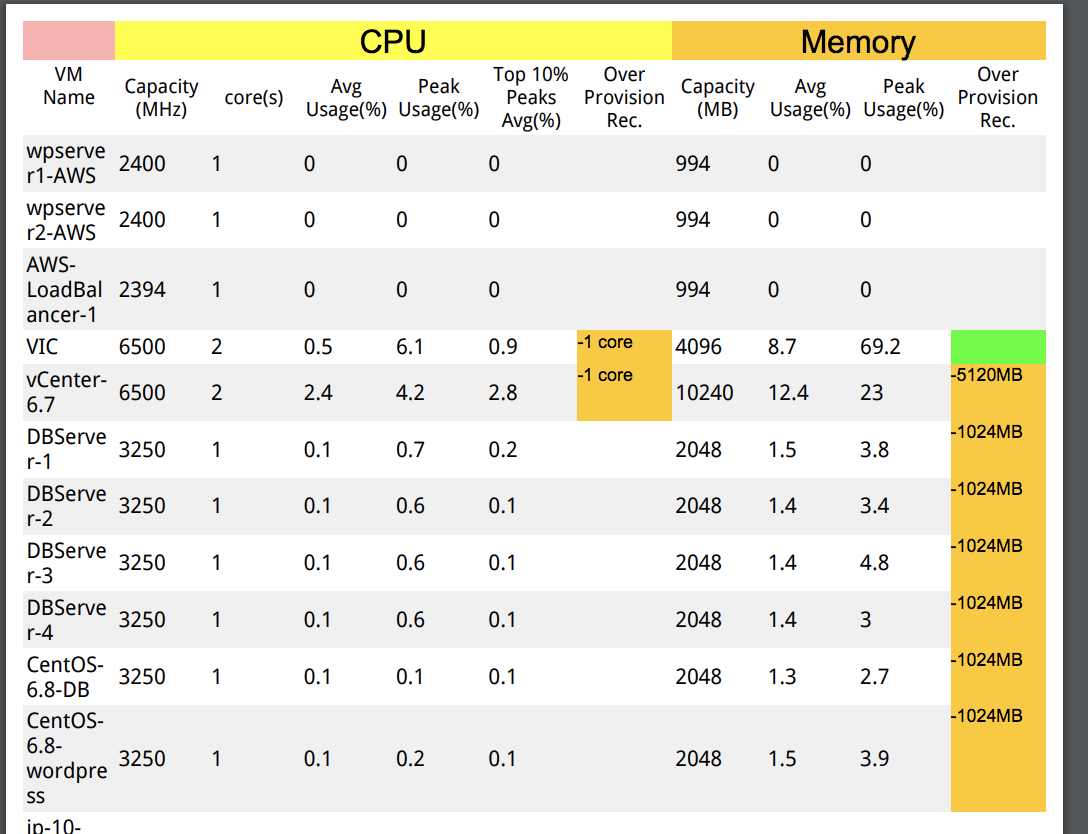
Rightsize and Optimize your VDI Deployment
.png)
- Visualize under-provisioned hosts or instances leading to application performance issues.
- Visualize money left currently on the table with over-provisioned infrastructure assets.
- Visualize VM performance and utilization for a variety of resources including CPU, Memory and compare usage trends with allocated resources.
- Generate right-sizing reports for VM resources and share with the rest of the team.
Resources
-
Uila Lightning Chat on most important aspect of VDI troubleshootingUila's VP of Marketing, Dilip Advani talks about the most important aspect of VDI troubleshooting, that is missed by many desktop teams, leading to major problems for the end-users.
-
Uila uObserve's intelligent NVIDIA GPU analytics for VDI TroubleshootingUila uObserve provides intelligent NVIDIA GPU metrics using the NVIDIA System Management Interface (NVSMI) to allow desktops teams to provide the maximized performance for GPU-enabled virtual desktops.
-
Uila real world use case: VDI Client slow down due to networking issueQuick video on how an enterprise organization used Uila uObserve to resolve VDI Client slow downs due to networking issues.
-
Uila real world use case: Repeated slowdown in VDI environment due to end-point security agentQuick video on how an enterprise organization faced repeated slowdown in their VDI environment due to end-point security agent solution.
-
Reducing Unplanned Downtime and Troubleshooting time for VDI/EUC DeploymentsQuick video that talks about the challenges faced by Desktop teams and how they can reducing unplanned downtime and troubleshooting time for VDI/EUC Deployments.
-
Uila VDI Troubleshooting BrochureQuick Solution brief on Uila for VDI End-to-end Monitoring & Troubleshooting.
-
Monitoring & Troubleshooting VMware Horizon VDI InfrastructureQuick video highlighting Uila’s VMware Horizon VDI monitoring capabilities with detailed metrics on applications, VDI protocols, session status, etc.
-
Success Story: US based Credit Union improved team communication efficienciesSuccess Story on a US based Credit Union that improved team communication efficiencies by resolving Video Conferencing challenges running over VDI.
-
VMUG Webcast: Resolve VDI Challenges with End-to-End VisibilityVMUG Webcast where Uila experts will talk about how to gain total end-to-end visibility to monitor, resolve and optimize your VMware Horizon VDI deployment.
-
Success Story: IT solutions organization adapts to new WFH requirementsUila Success Story on how an organization providing IT solutions for Moving and Relocation services, adapted to new WFH (Work From Home) requirements due to the recent health epidemic.
-
The Definitive Guide to VDI MonitoringIn this paper, we will cover one of the most important aspects of monitoring Virtual Desktop Infrastructure (VDI) in the enterprise environment.
-
Success Story: Healthcare Organization solves Network Saturation issue impacting VDI usersCase study on Healthcare organization that was able to resolve "access is slow" complaints from their VDI users.
-
Success Story: Enterprise Organization Resolves VDI slowdowns for certain "users"Case study for an Enterprise Organization that was able to resolve VDI slowdown complaints from a group of users.
-
Webinar: Troubleshooting VDI Performance ChallengesLearn about the Top 5 challenges faced by organizations on VDI performance and how to solve them.
-
Enterprise Organization with VDI Performance Challenges Success StoryEnterprise organization in Asia that was able to solve their VDI environment's performance issues by isolating the root-cause down to corporate policy violations for a single user.
-
Uila CEO on Troubleshooting VDI PerformanceChia-chee Kuan, CEO of Uila talks to Actual Tech Media on Troubleshooting VDI Performance Issues.
-
VDI Troubleshooting (Desktop Slowdown) with Uila: Network IssuesVideo on how Uila is used for VDI client slowdown challenges due to network issues.
-
VDI Troubleshooting (Desktops Freezing) with Uila: Storage IssuesVideo on how Uila is used for VDI desktop freezing challenges due to storage issues.
-
VDI Troubleshooting (Slow website access) with Uila: DNS IssuesVideo on how Uila is used for VDI slow website access challenges due to DNS issues.
Ready to begin your Monitoring Journey with Uila?
Start a 30-day Free Trial Now
Request Trial


