New Visibility for Network Operations like Never Before: "Prove it's NOT the Network"
-
Just like storage gets blamed for most problems, so does the network. Network Operations teams are often blind to east-west traffic, which could be a security issue or VM migrations. Having visibility into this traffic is critical for Network teams.
Network Operations teams are often in the modern data center tasked with transitions to a virtual environment and need to identify networking problems quickly, even in the virtual network.
Traditionally used Network Performance Monitoring (NPM) solutions are missing many critical capabilities that actually help you solve the challenges for the end-user performance issue. This includes Compute resource visibility, Storage resource visibility, Application server health visibility, Application transaction emulation, a complete view of the network and the ability to identify root cause if it’s not the network.
Read more about things that NPM can't tell you by clicking the button below
Things NPM can't tell you
Monitor Health for your Virtual Network & Reduce MTTR for Business-Impacting Issues
- No specialized help needed from Network teams needed to install and monitor the performance.
- Vendor-agnostic for the networking infrastructure across on-premise and cloud deployments.
- Guarantee High Network Availability at all times.
- Triage to root-cause for Network issues in your virtual infrastructure (downtime and slow performance) and avoid fingerpointing between networking teams.
- No expensive appliances or Hardware TAPs needed for monitoring the network.
End-to-end, Real-time & Continuous Network Monitoring
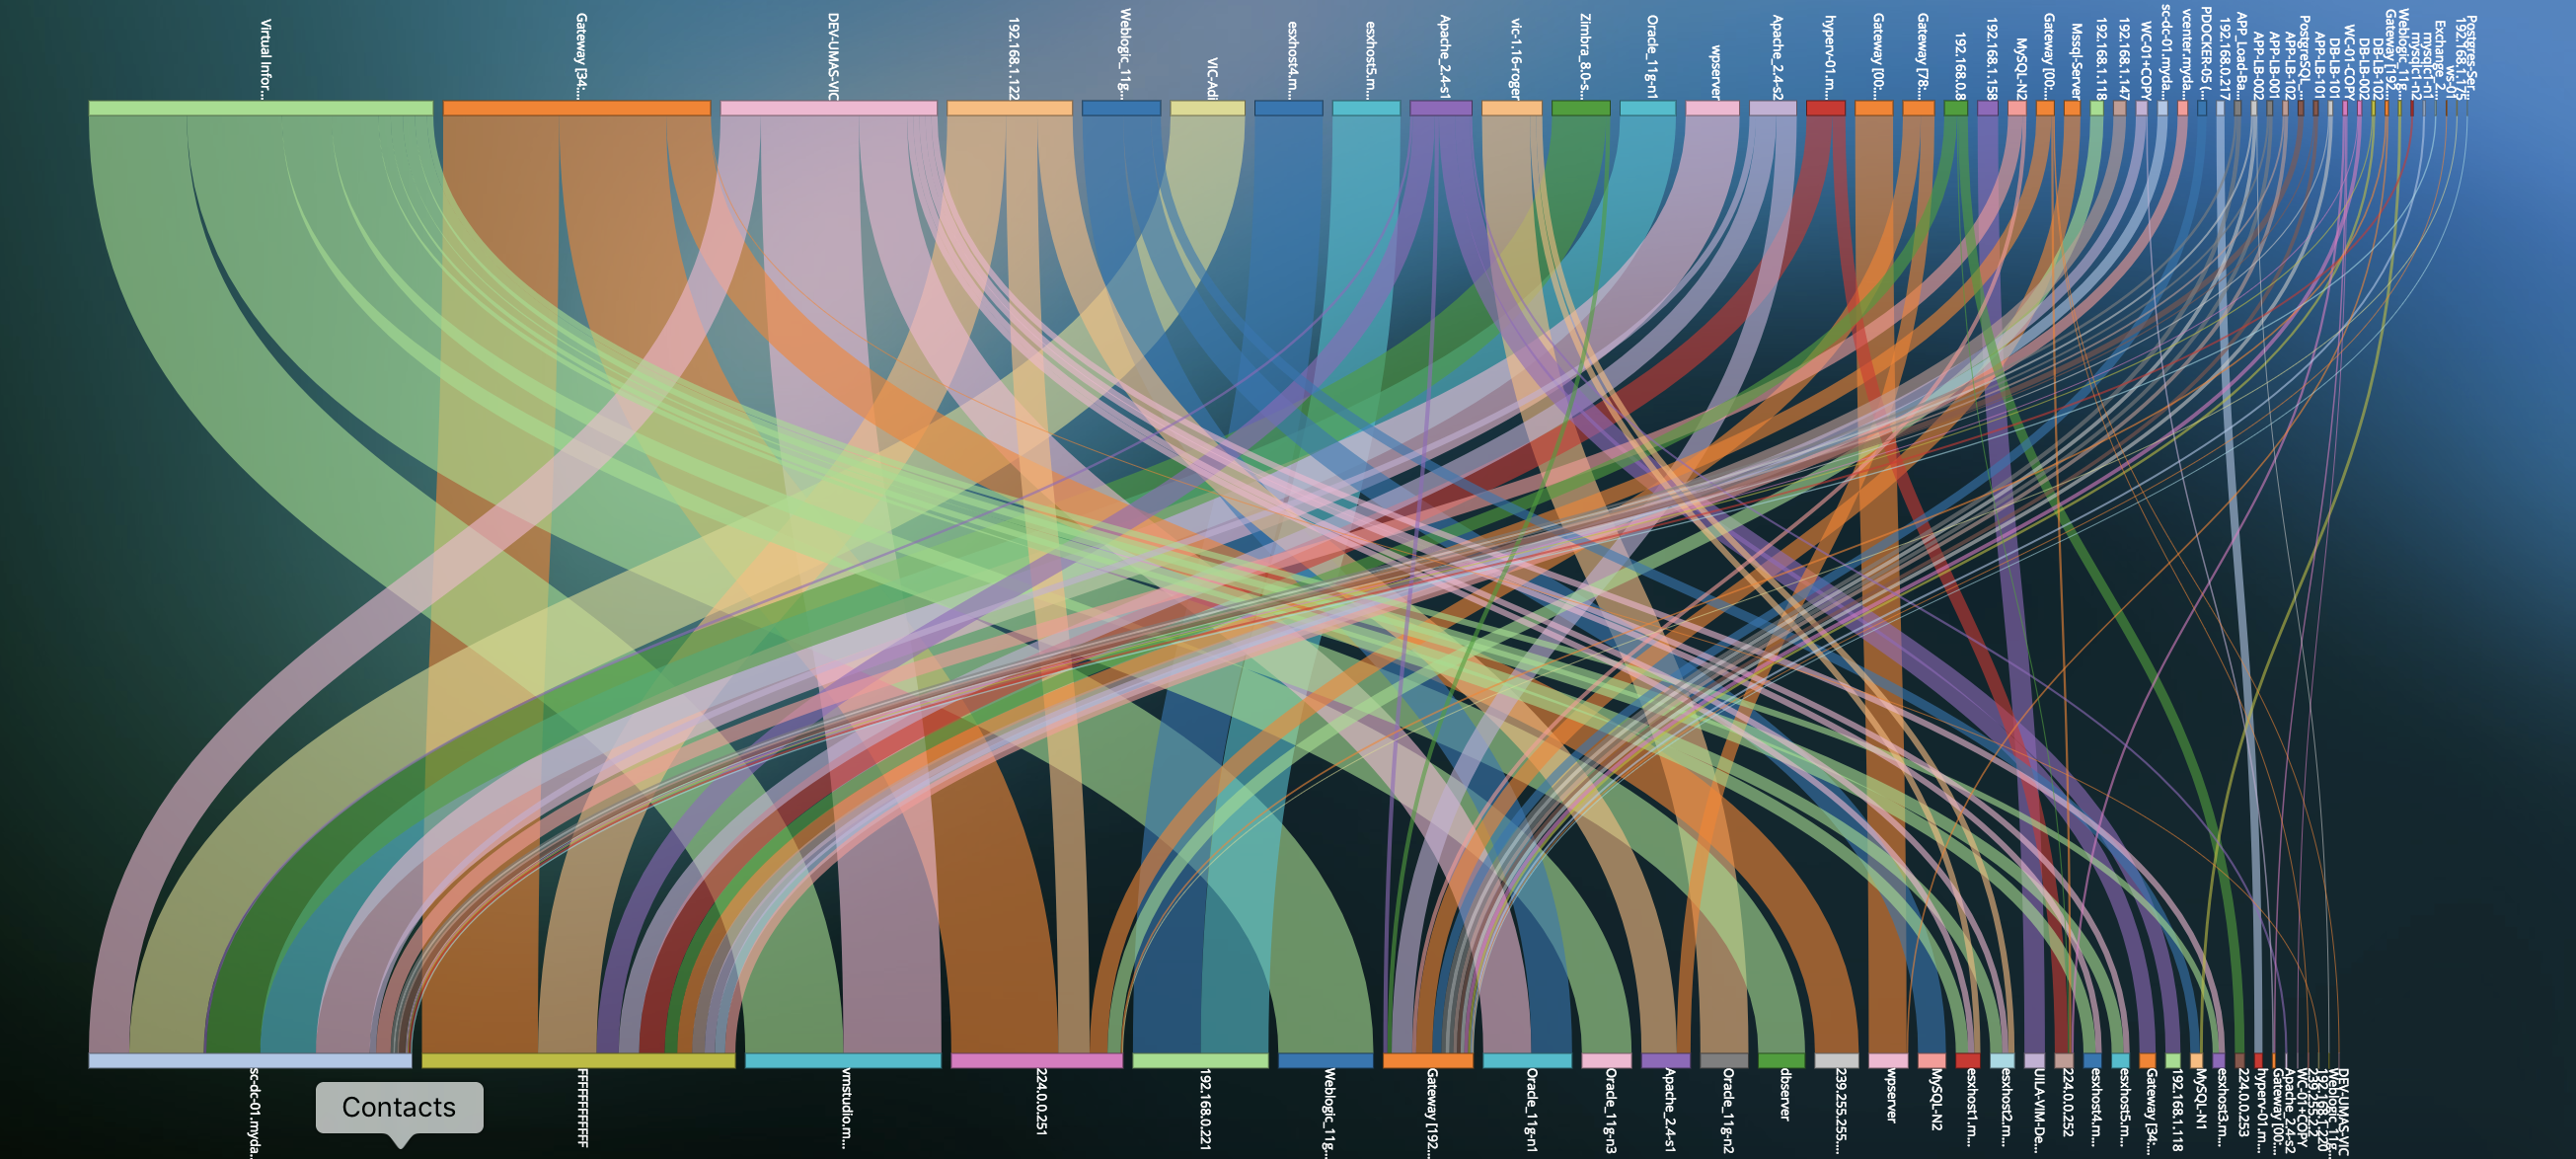
- Visualize how vAPP network traffic traverses across physical devices, virtual entities & Application Services, to pinpoint network hot spots impacting application performance.
- Review Network Round Trip Time, Traffic Volume, Retries, Packet Drops, Application Response Time for each application.
- Top-down visualization approach from the Application or Business Service to its correlated Infrastructure and Network root cause for faster root cause resolution.
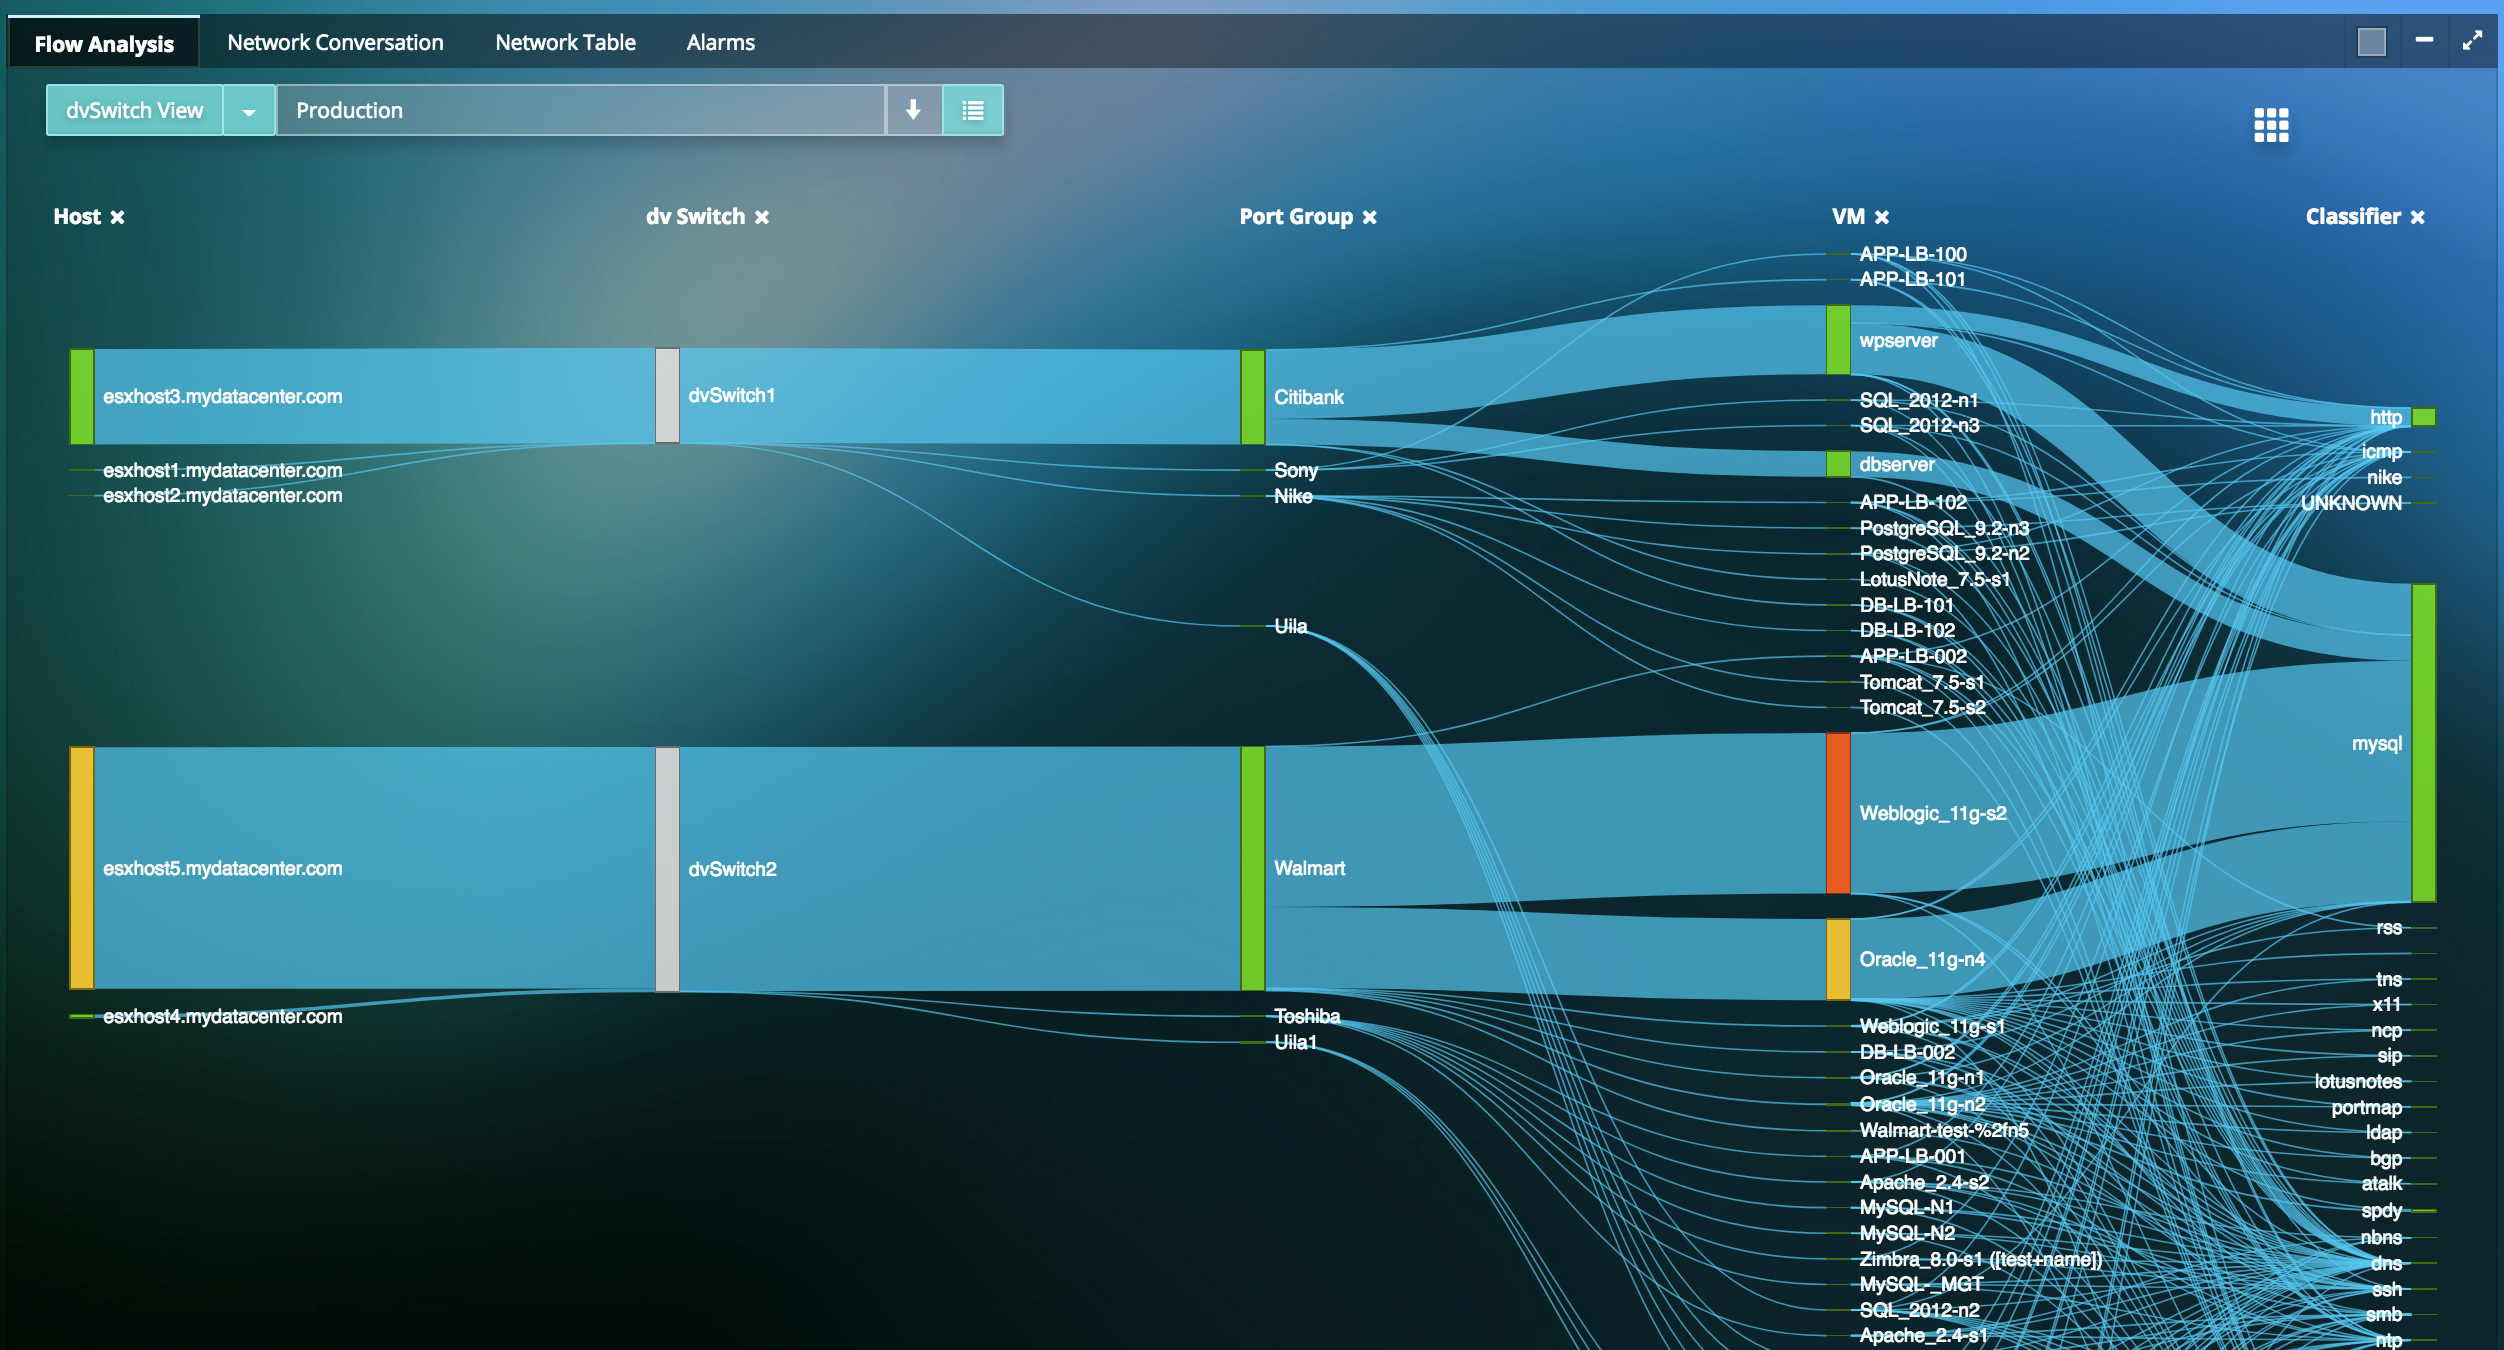
Application-Centric Network Device Monitoring
- Diagnose and Resolve Network Device outages and performance issues that are impacting application performance. Prove its NOT the network. Pin-point root cause for application issues due to network devices right from the Application Dependency Map.
- Monitor network device health, availability and bandwidth usage, as well as various other network parameters for traffic statistics including errors, discards, etc.
- Visualize connected VMs to every single switch port and its Application, CPU, Memory and Storage Health to pinpoint performance challenges due to the network device bottleneck.
- Detailed status and configuration settings for network devices including vendor, model, OS versions, uptime, serial number, VTP domain, detailed description, IP/MAC address, etc.
Click here for more details on Uila's Network Device Monitoring capabilities.
Network Device Monitoring
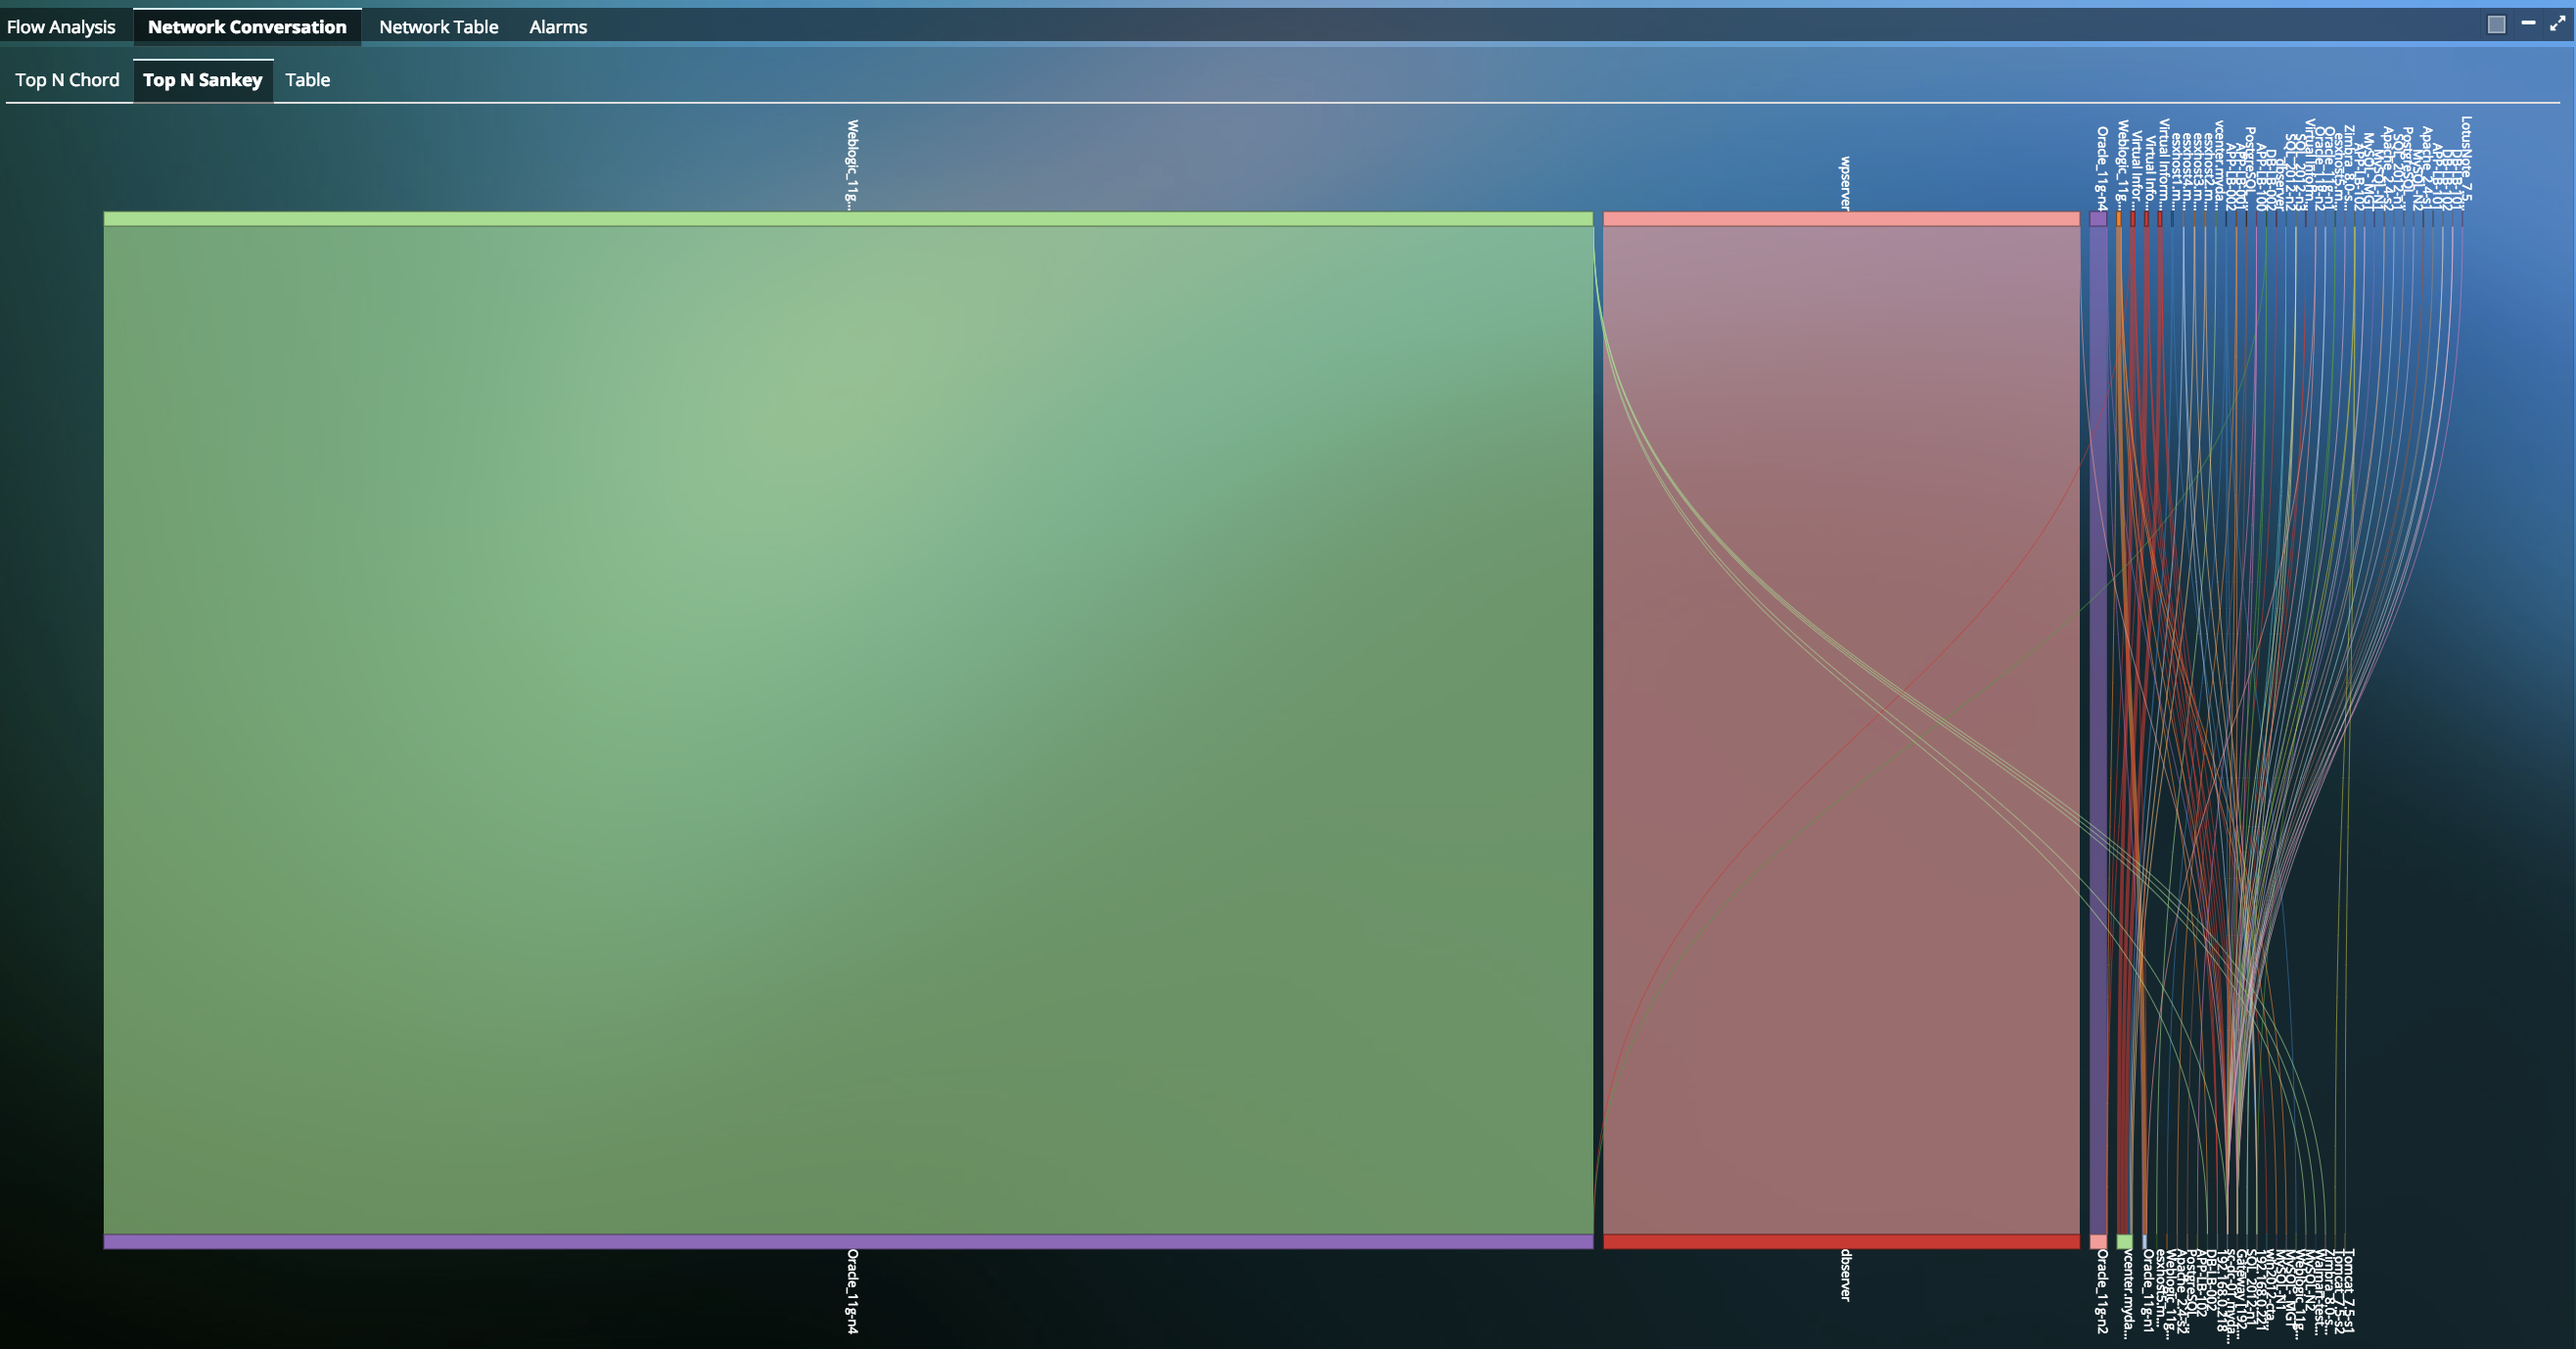
East-West Traffic & Network Topology Insight
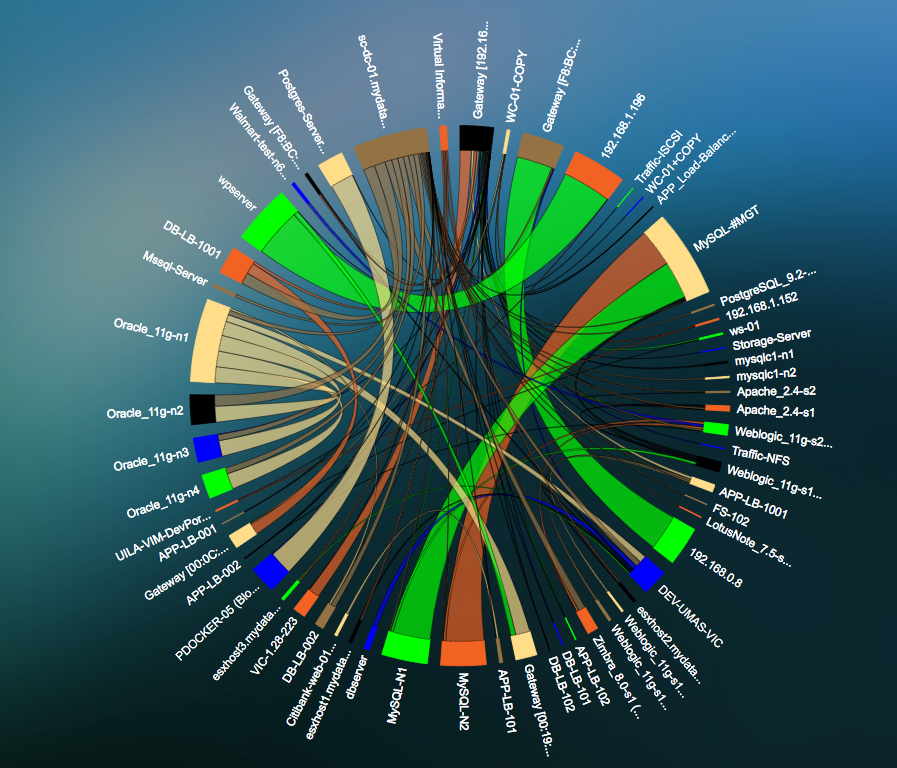
- Visual correlation of network data across entire infrastructure with quick drill downs into status and performance.
- Visualize the top highest network traffic volume East-West VM pairs that may impact performance of others.
- Instant recognition of new devices or connections for comprehensive and up-to-date view of your network infrastructure.
Prove its NOT the Network with real End-user measurements
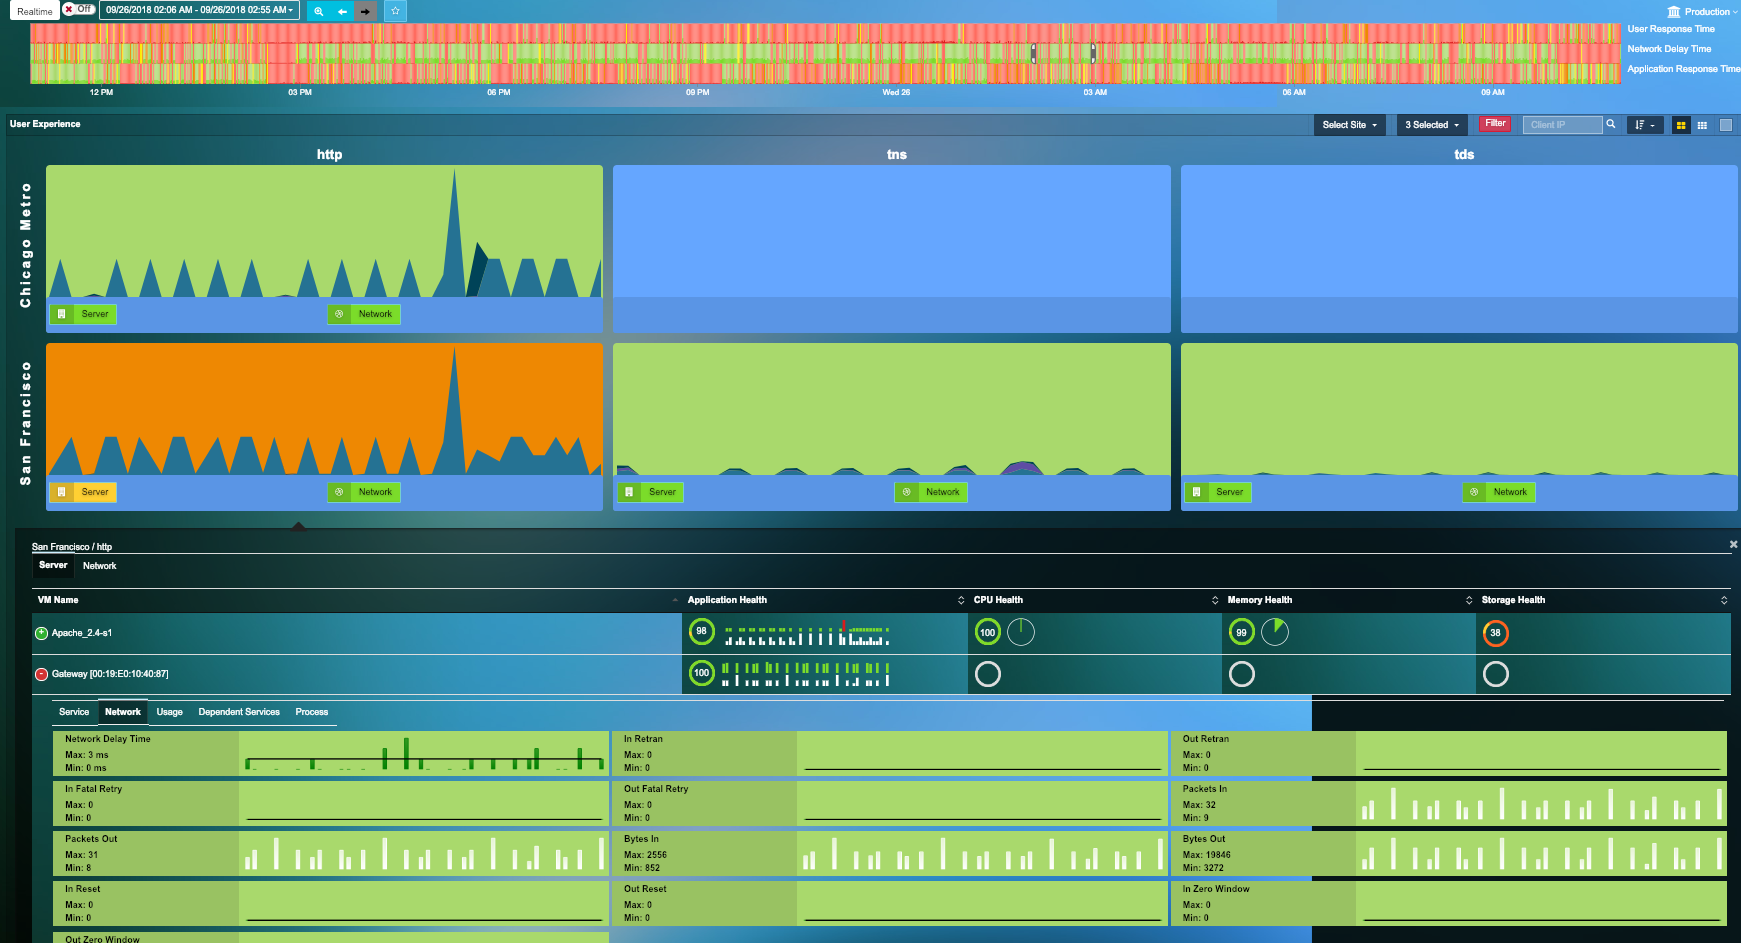
- End user response time tracking proactively alerts IT to service degradation from the user's perspective before user and revenue impact. Easily pinpoint that the Network is NOT the root cause.
- Response time analysis breaks down delays by the server, network, storage, application and clients.
- Site-by-site and client-by-client analysis isolates and correlates user issues to the real root cause, thus speeding up troubleshooting time.
Leverage existing Network Packet Broker (NPB) Infrastructure and Investment
- Leverage your existing Network Packet Broker (Niagara Networks, Ixia, etc.) infrastructure and investment by forwarding network traffic from the NPB to Uila's Virtual Smart Taps.
- Add much needed visibility for Application Performance based on Deep Packet Inspection of the network traffic.
- Combine north-south and east-west traffic in a single network traffic analysis view. Get full access to KPIs such as bandwidth, transaction volume, drops, retries, etc.
- Troubleshoot network issues proactively at lightning speeds with full visibility and bottleneck detection across the full-stack and all infrastructure dependencies. Uila's dependency maps are generated automatically, and without any agent deployment.
Click here for more details on Uila's Integration with Niagara Networks
Uila-Niagara Networks Integration
Resources
-
Network Performance Monitoring with UilaQuick product video on how to use Uila for Network Performance Monitoring
-
6 things missing in NPM toolsNetwork performance monitoring remains an essential tool for network and IT operations managers, but it’s no longer sufficient for modern IT infrastructure.
-
Detecting Virtual Packet Drops with UilaVideo on Uila Identifying Virtual Network Packet Drops.
Ready to begin your Monitoring Journey with Uila
Start a 21-day Free Trial Now
Request Trial


