Visibility into Server Performance
- Single Pane of glass for Application-centric insights into Server Performance, including CPU, Memory & Storage statistics.
- Get to root-cause fast for any server performance issues. Visualize Application Response Times for any application running on the server, transactions, traffic statistics, etc.
- Full visualization into Server hierarchial landscape all the way up to the Cluster and Data Center.
- Complete visibility into processes and applications running on any physical or virtual server.
Eliminate pain points within the Compute Infrastructure
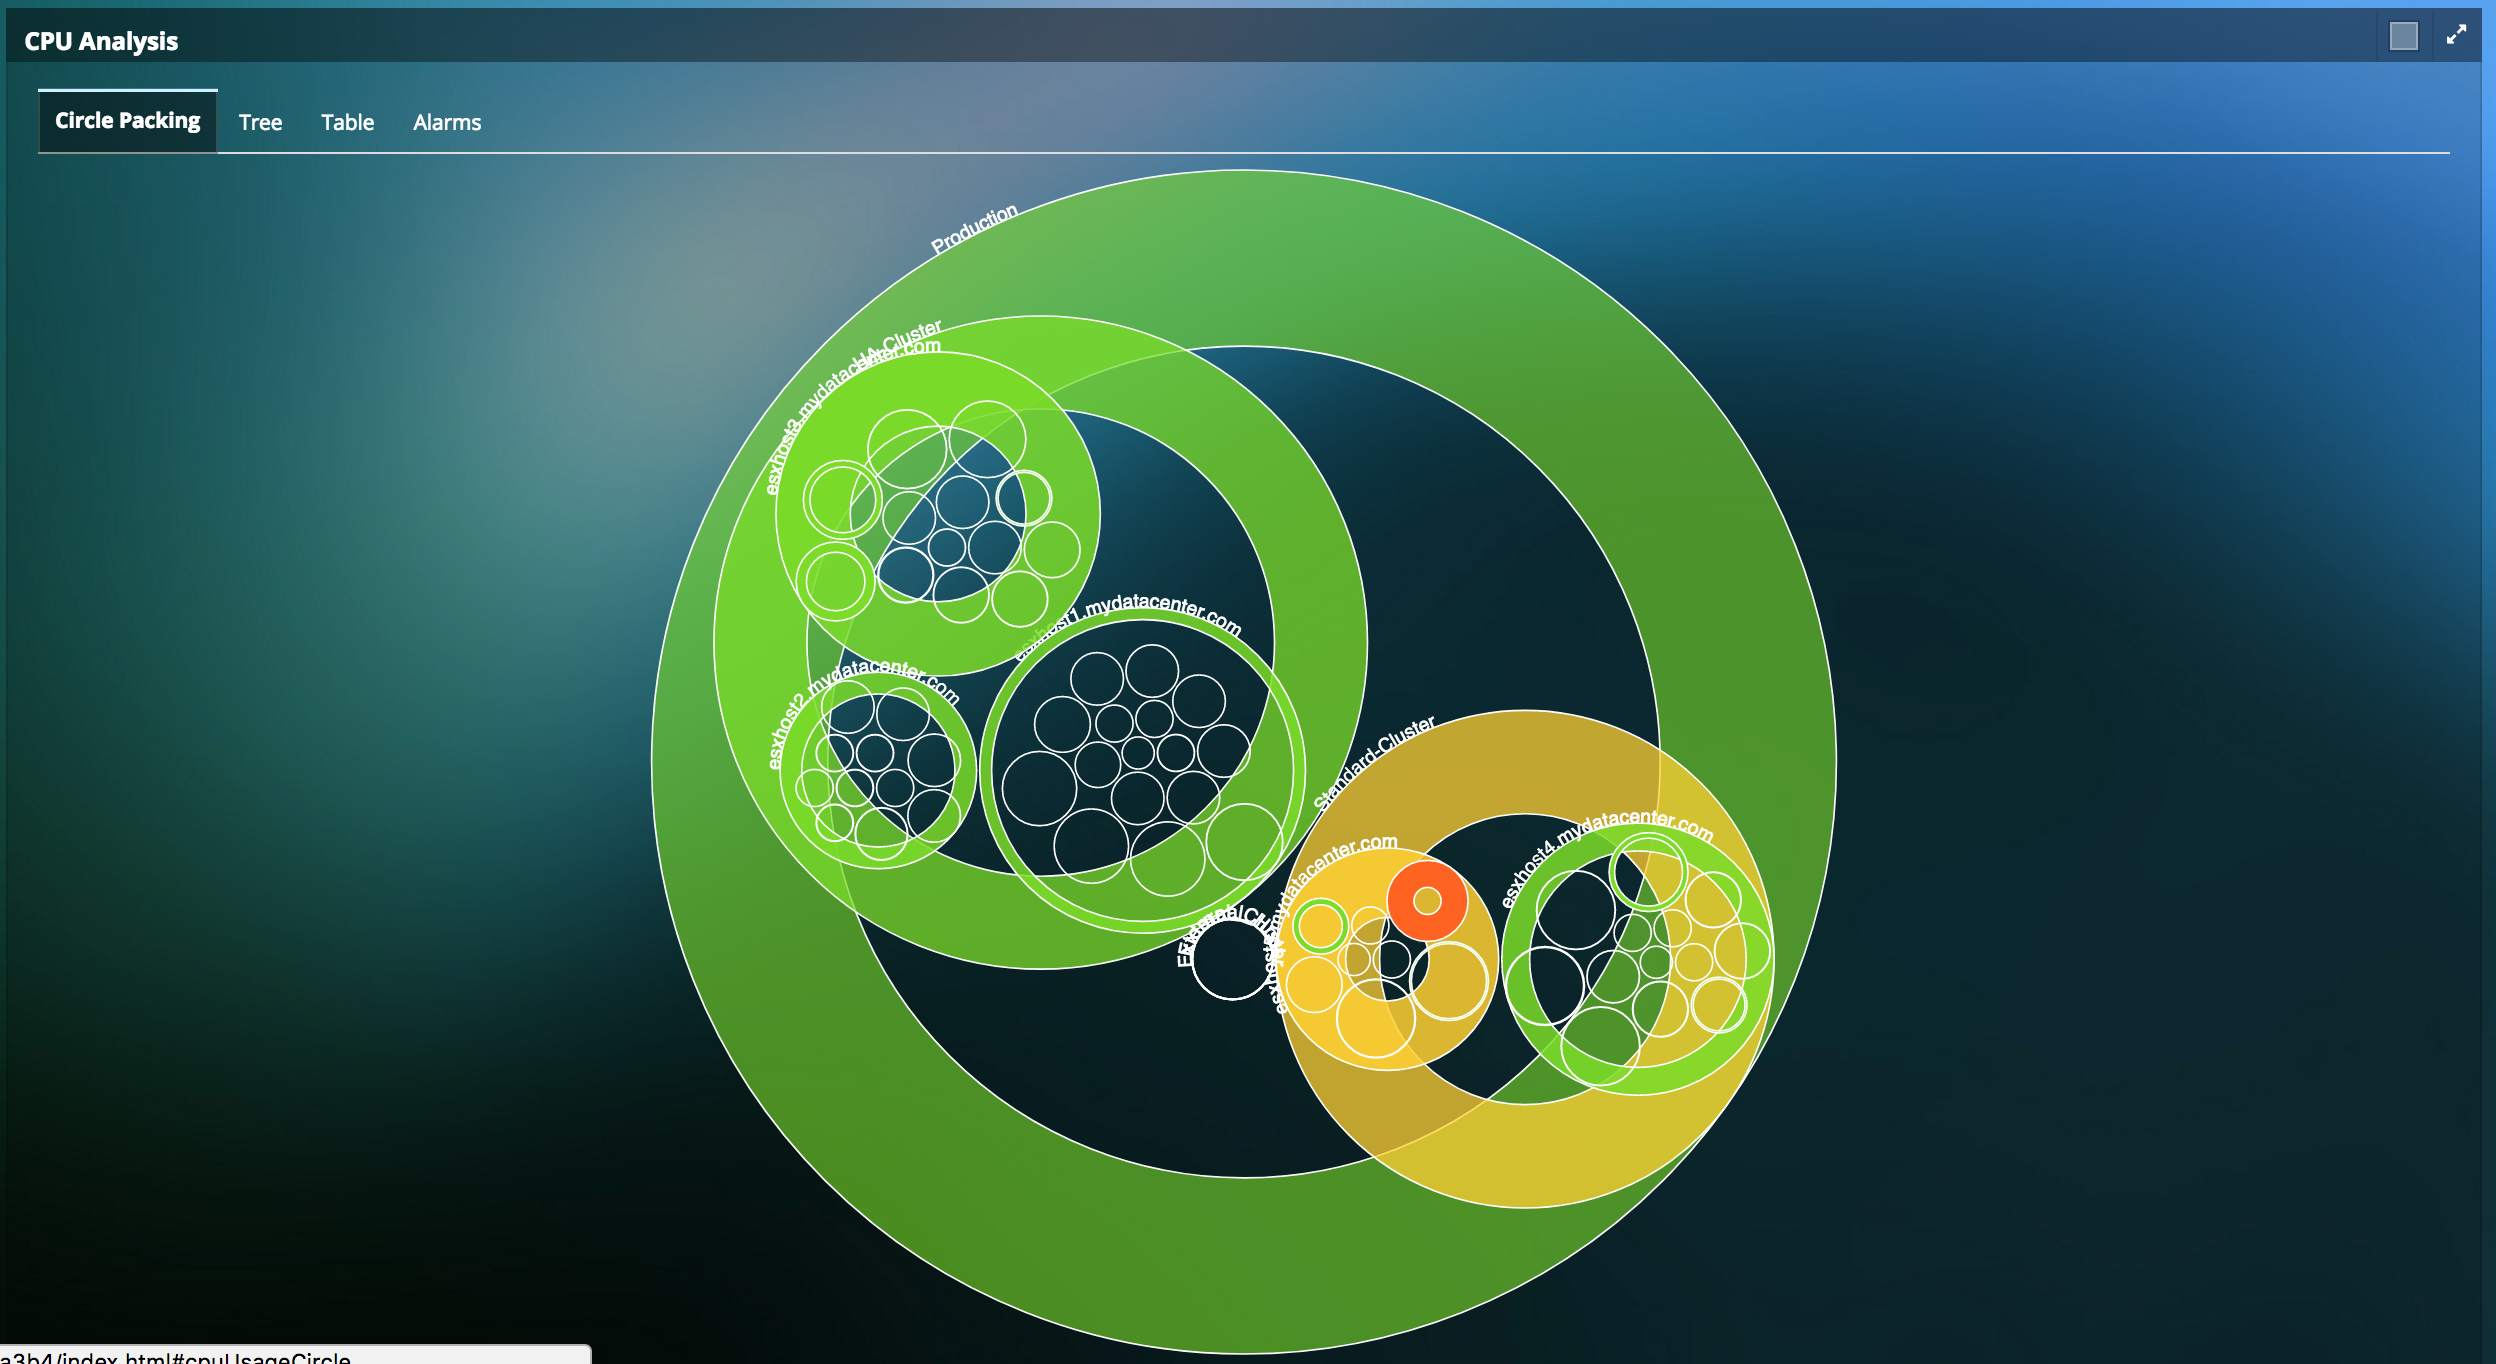
- Visualize how compute performance in the data center affects application performance by measuring metrics such as CPU swap wait, CPU Ready, Utilization and tie this to the Application Response Time.
- Visualize performance of all memory arrays in your hosts with respect to the infrastructure currently running in your data center. Get up-to-date information on memory usage, swap rate, swap wait times, etc.
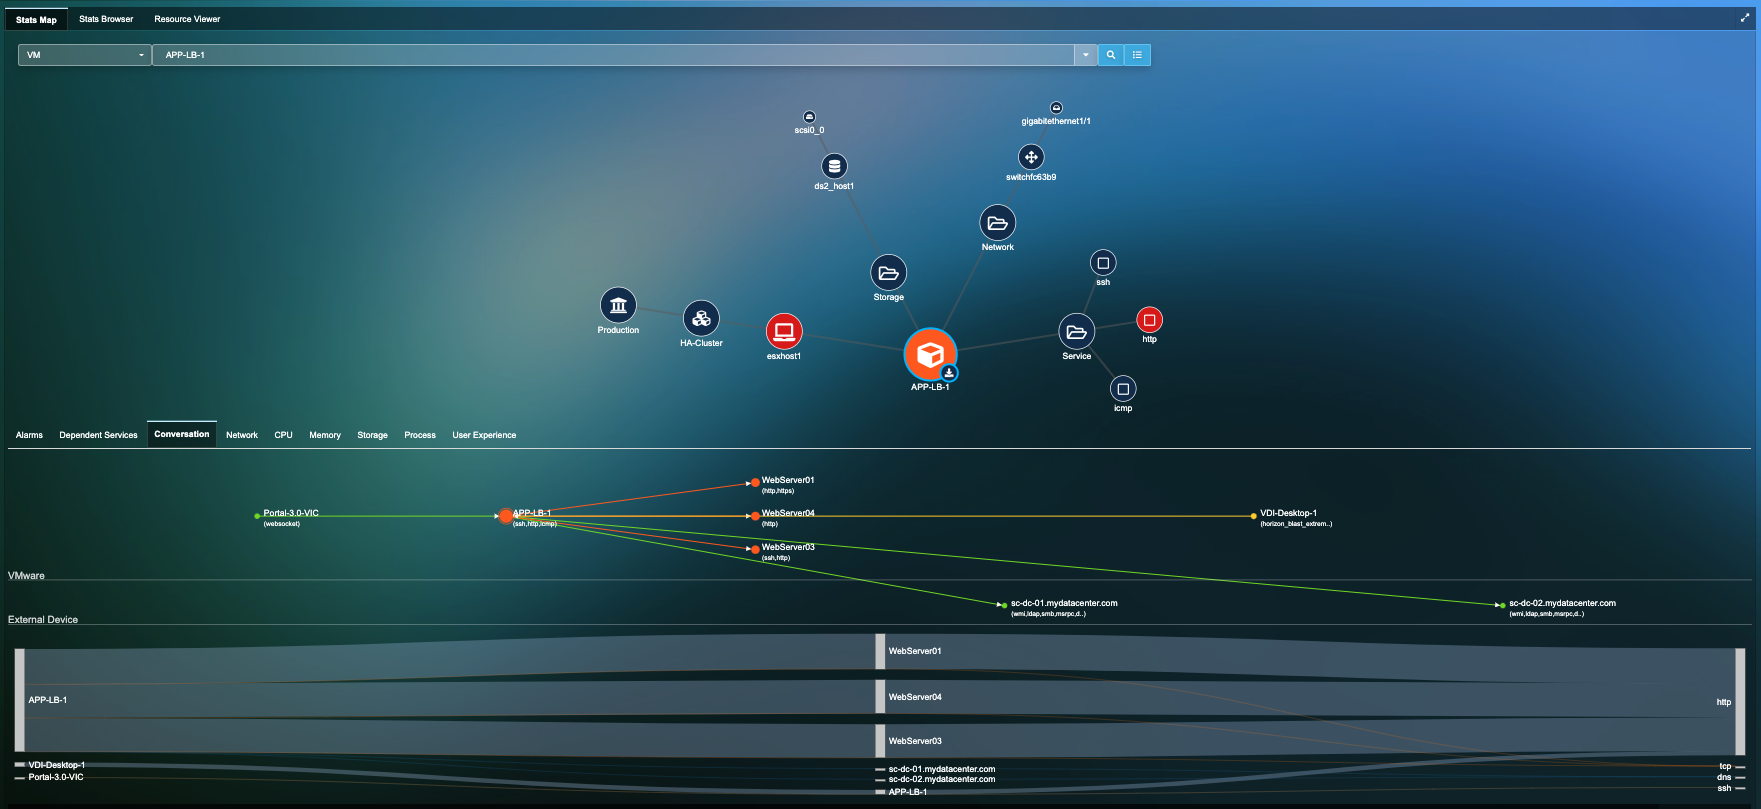
End-to-end, Real-time & Continuous Network Monitoring
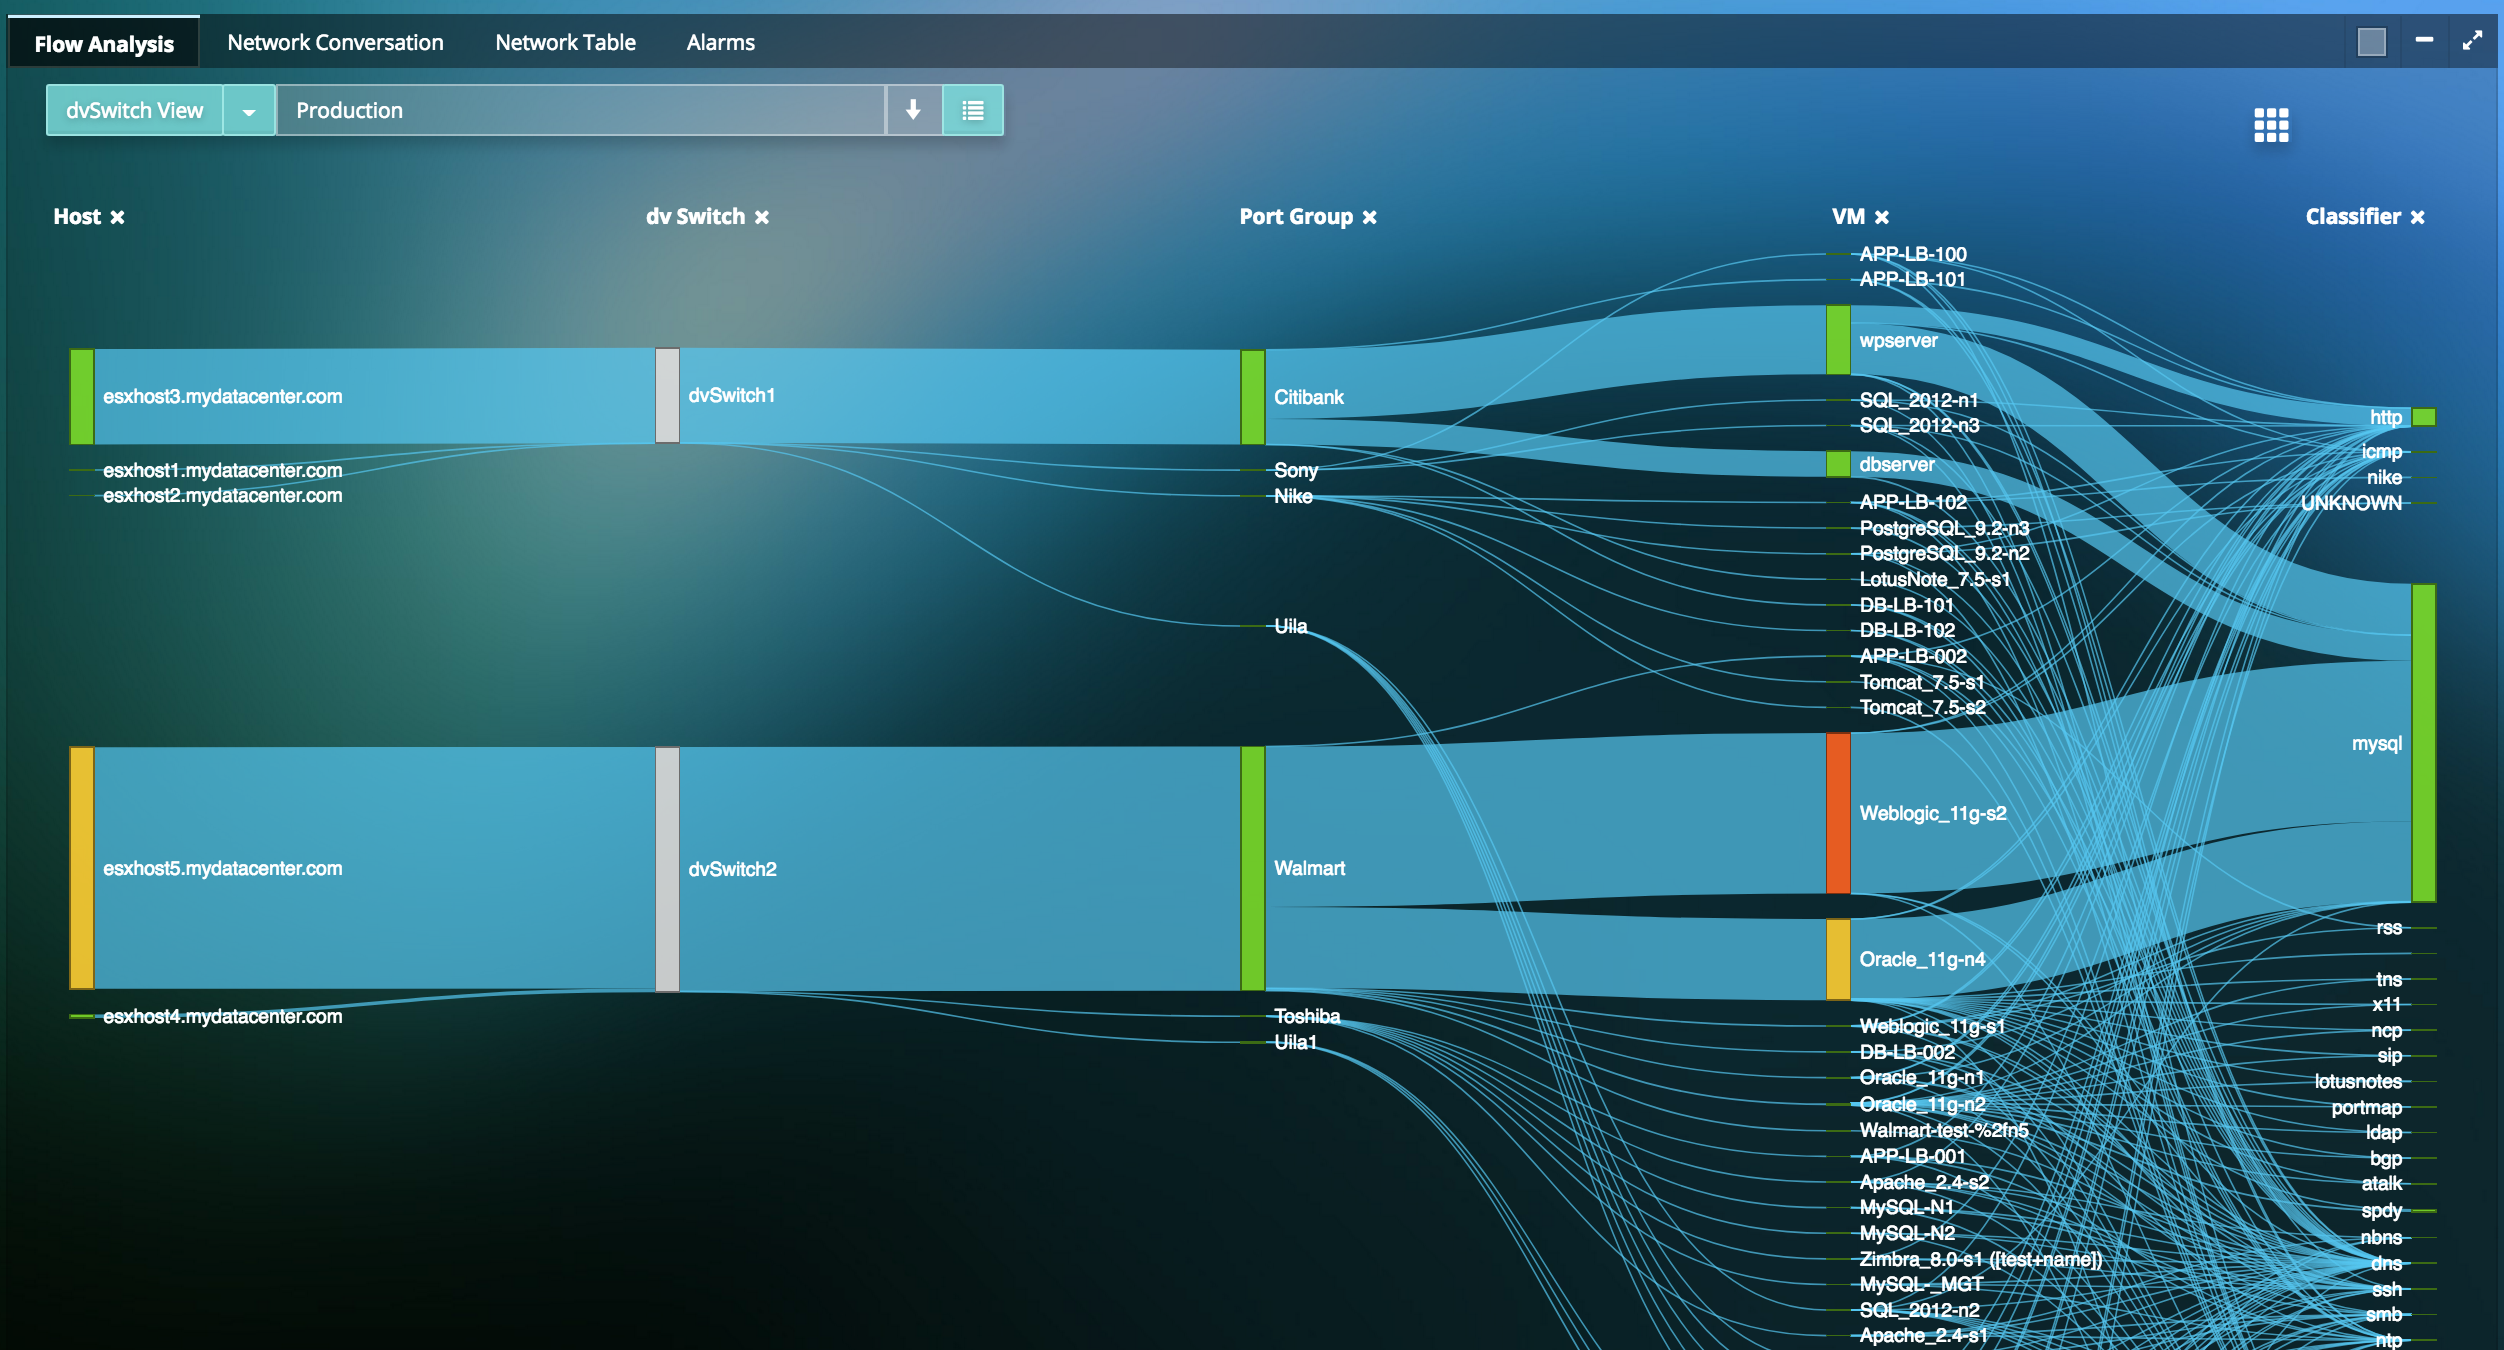
- Visualize how network traffic traverses across physical devices, virtual entities & Application Services, to pinpoint network hot spots impacting application performance.
- Review Network Round Trip Time, Traffic Volume, Retries, Packet Drops, Application Response Time for each application.
- Top-down visualization approach from the Application or Business Service to its correlated Infrastructure and Network root cause for faster root cause resolution.
Clear bottlenecks and weaknesses in Storage Performance
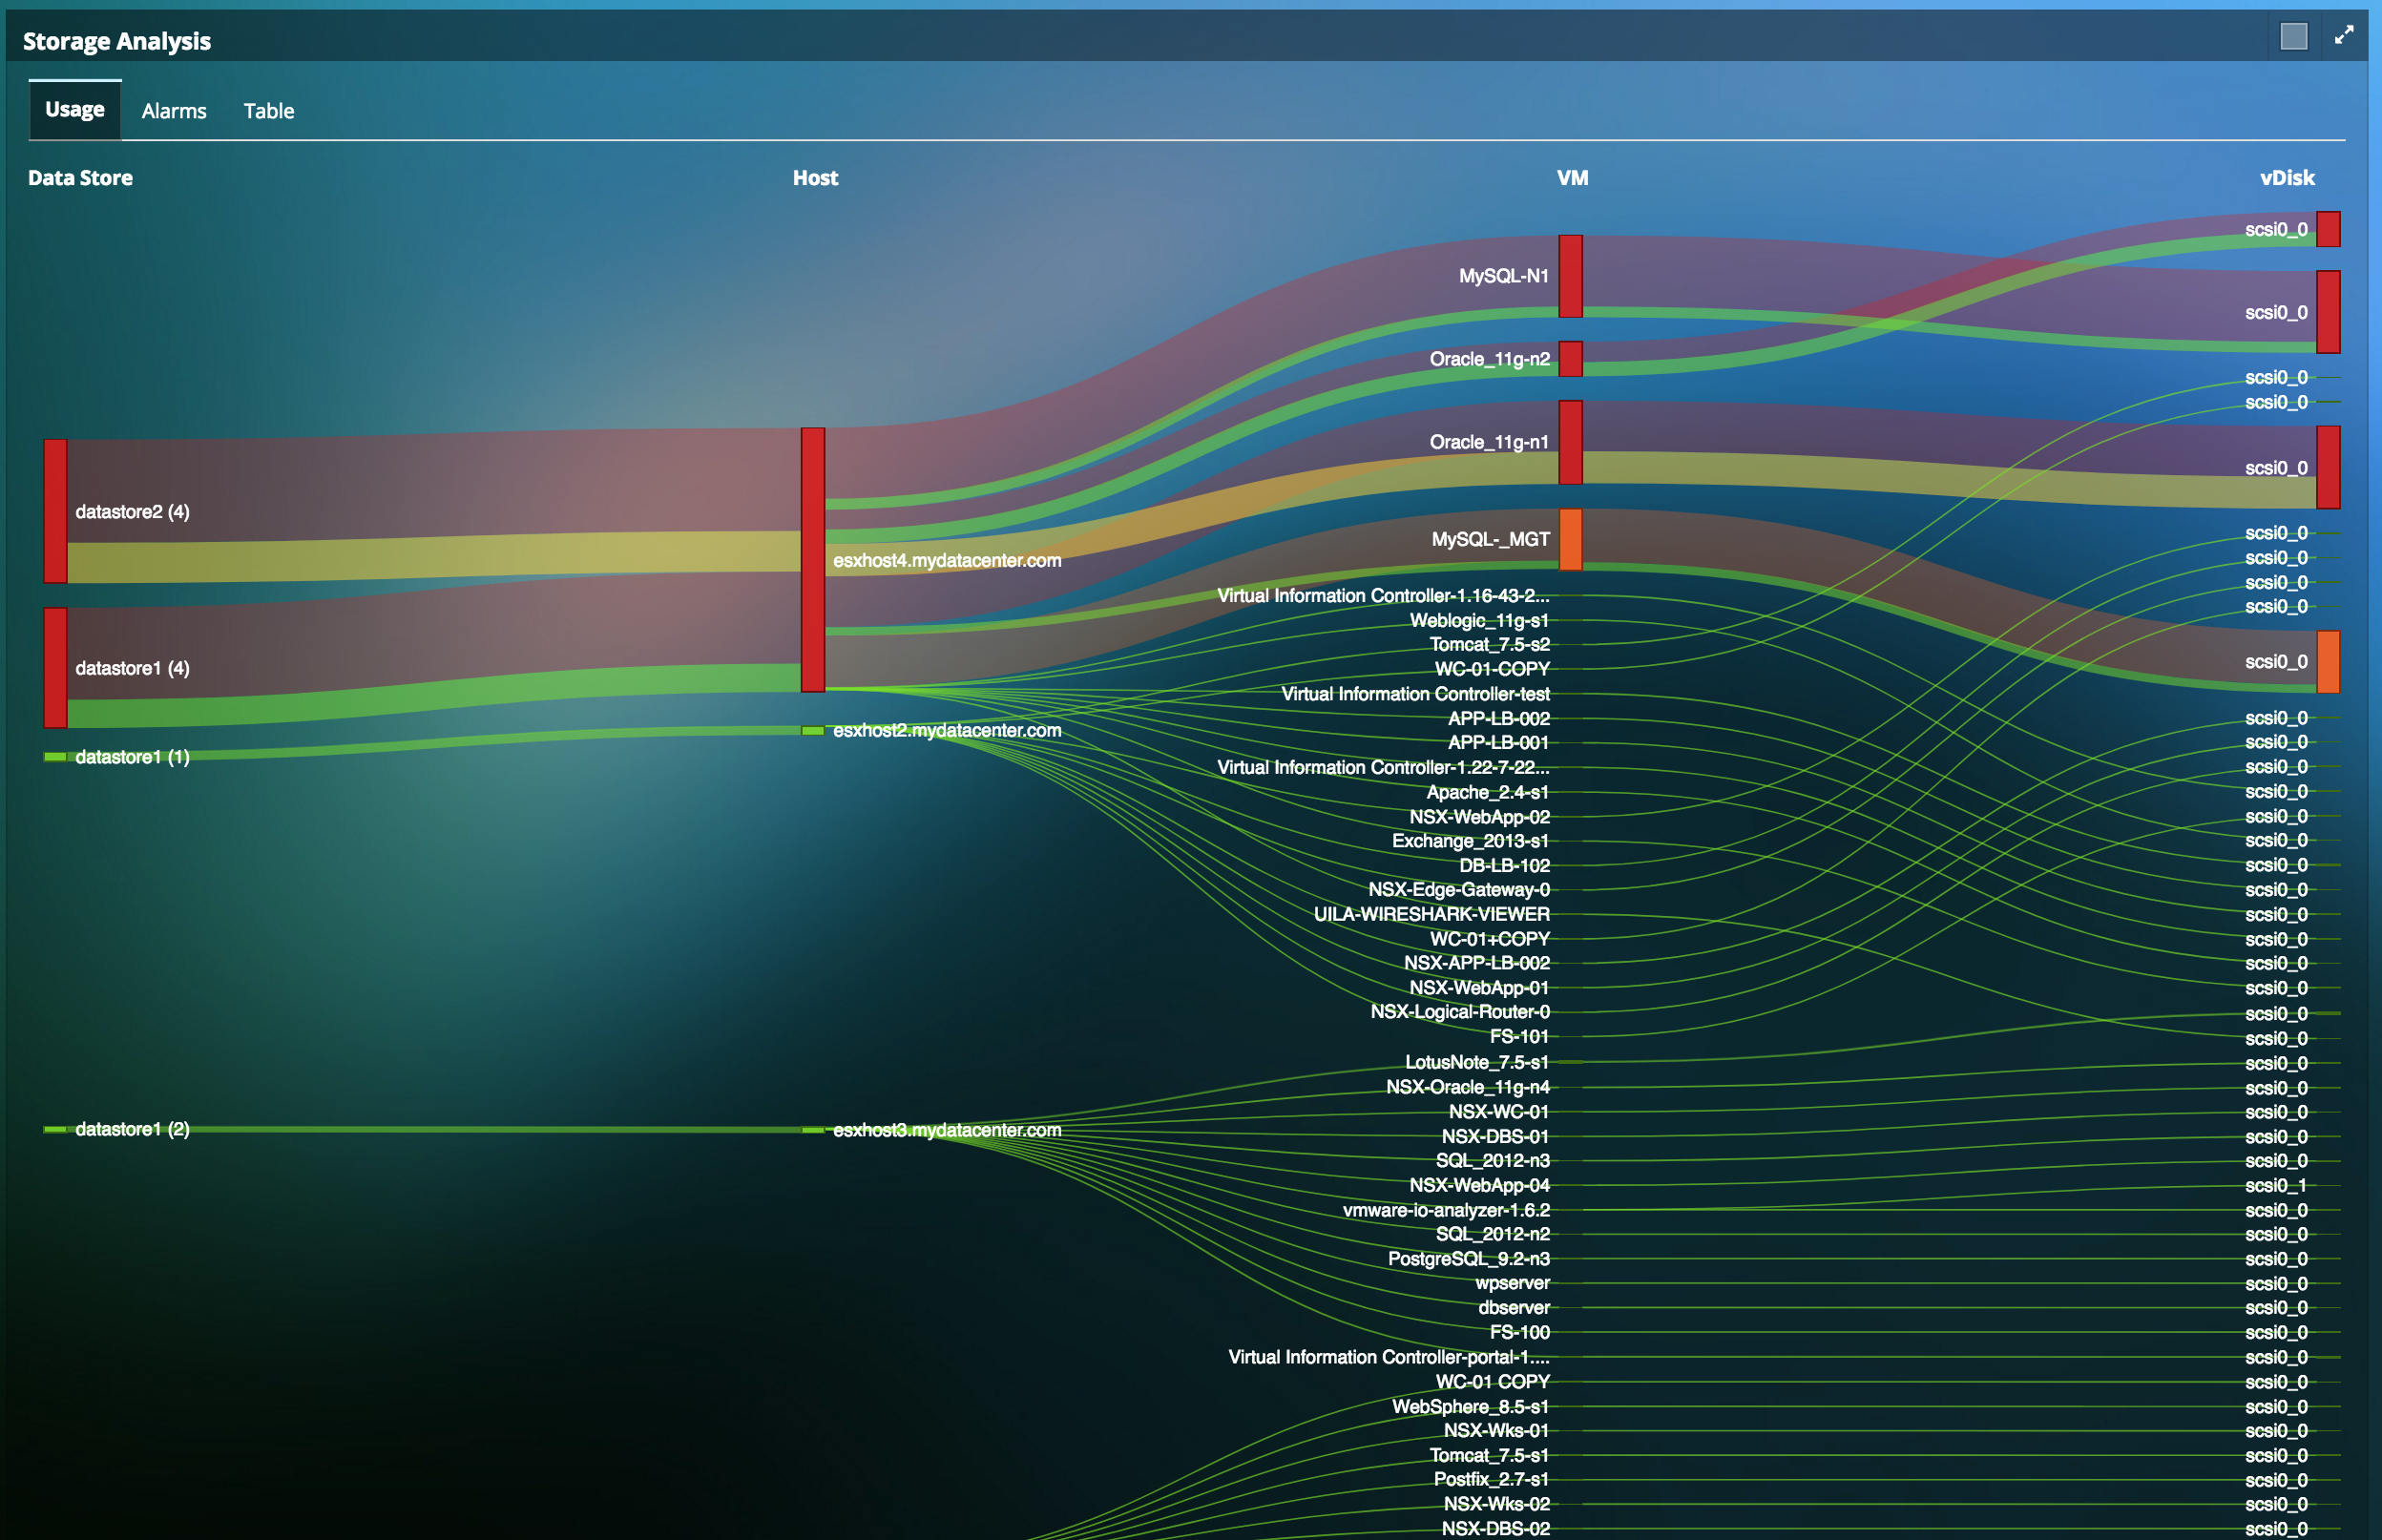
- Monitor Storage performance across multiple vendor’s storage arrays on a 24 x 7 basis.
- Simplify capacity planning procedures with insights into storage hotspots.
- Visualize trending performance issues on Read/Write latencies and IOPS across VMs, vDisk and Data Stores.
- Understand the problematic tiers within your storage infrastructure and isolate any performance issues.
Full Stack Observability in a Single Product
- Align business and IT Operations goals in a single product with application visibility and correlated network, compute and storage insights
- Full stack visibility (Application Performance Monitoring, Infrastructure Performance Monitoring, Network Monitoring, Storage Monitoring) for virtualized data centers reduces troubleshooting time from days to minutes, enabling lean IT teams to get time back for more strategic projects
- Infrastructure and application health visualization shines a spotlight on bottlenecks that are affecting application performance.
Resources
-
Uila real world use case: Resolving Application issues due to Database challengesQuick video on how an IT team resolved Application issues for their intranet file/document sharing application due to Database challenges.
-
Troubleshooting MSSQL Database Engine errorsQuick video on the different severity level errors for MS-SQL and how to identify them using Uila uObserve’s Log Analysis and Observability.
-
Infrastructure Performance Monitoring with UilaQuick product video on how to use Uila for Infrastructure Performance Monitoring
-
Uila Support for Microsoft environmentsQuick 2-page Solution brief on Uila Support for Microsoft environments.
-
Monitoring Storage Disk Usage with UilaQuick video on how to measure Storage Disk Usage with Uila.
-
Hospital Group saves $500K based on Rightsizing Guidance from UilaUS-based Hospital Group saves $500K based on Rightsizing Guidance from Uila for their Epic EMR Database.
-
Uila Stats MapQuick video on how Uila can be used to monitor critical metrics or statistics for various assets like VMs, servers, network port, storage, etc.
-
Objectivity Success StorySuccess Story for Objectivity, Inc. a big data analytics software producer, solved random server slowdowns for their QA teams.
-
Read Analyst Insights on solving Infrastructure ProblemsSolving the Top 5 Virtualized Application & Infrastructure Problems by David Davis- ActualMedia Tech
-
A Datacenter With a View. Not with logging!!!In this blog we talk about how simple collection of logged data is not enough to get true visibility into a Hybrid environment.
Ready to begin your Monitoring Journey with Uila?
Start a 30-day Free Trial Now
Request Trial


