Very smart people have been inventing and creating the better mousetrap for collecting data across all datacenter devices and interfaces for decades.
“Syslog Server”
Did you just cringe? Then you’re probably logging thousands of files with thousands of lines just to try to find out why something happened. It’s a part of everyday life as an IT admin, and something that you choke down as sour medicine. You just want to move onto the next project as soon as you get out of crisis mode, i.e. trying to figure out what happened to that server that went offline at 3AM.
The rise of extensibility, APIs, and HTML5 has helped eliminate the administrative overhead required to deploy, update, and manage agents on your servers and various devices. But that was never really the big problem. The big problem is making sense of the data after logging and storing it all.
Colonel Mustard with the Candlestick in the Study
Logging is logging. Data is data is data. Each line of your logged output is simply raw data, and without a very experienced engineer to connect the dots like they’re playing a good game of CLUE and developing that data into actionable information, you’re simply left with lines of output in a .txt file.
Plenty of companies have tried their hand at building the “one interface to rule them all,” but they’ve never really delivered. Applications still have their own ways of being monitored; infrastructure has its own set of tools.
But what if someone figured out how to combine the two? Discovered a way to correlate data from both infrastructure and applications, all into a powerful single view?
Application & Infrastructure Monitoring for the future
Uila has created the most powerful and intuitive user experience for lean IT teams, allowing their admins and developers alike to get a complete full-stack view from the app to the power plug, and everything in between.
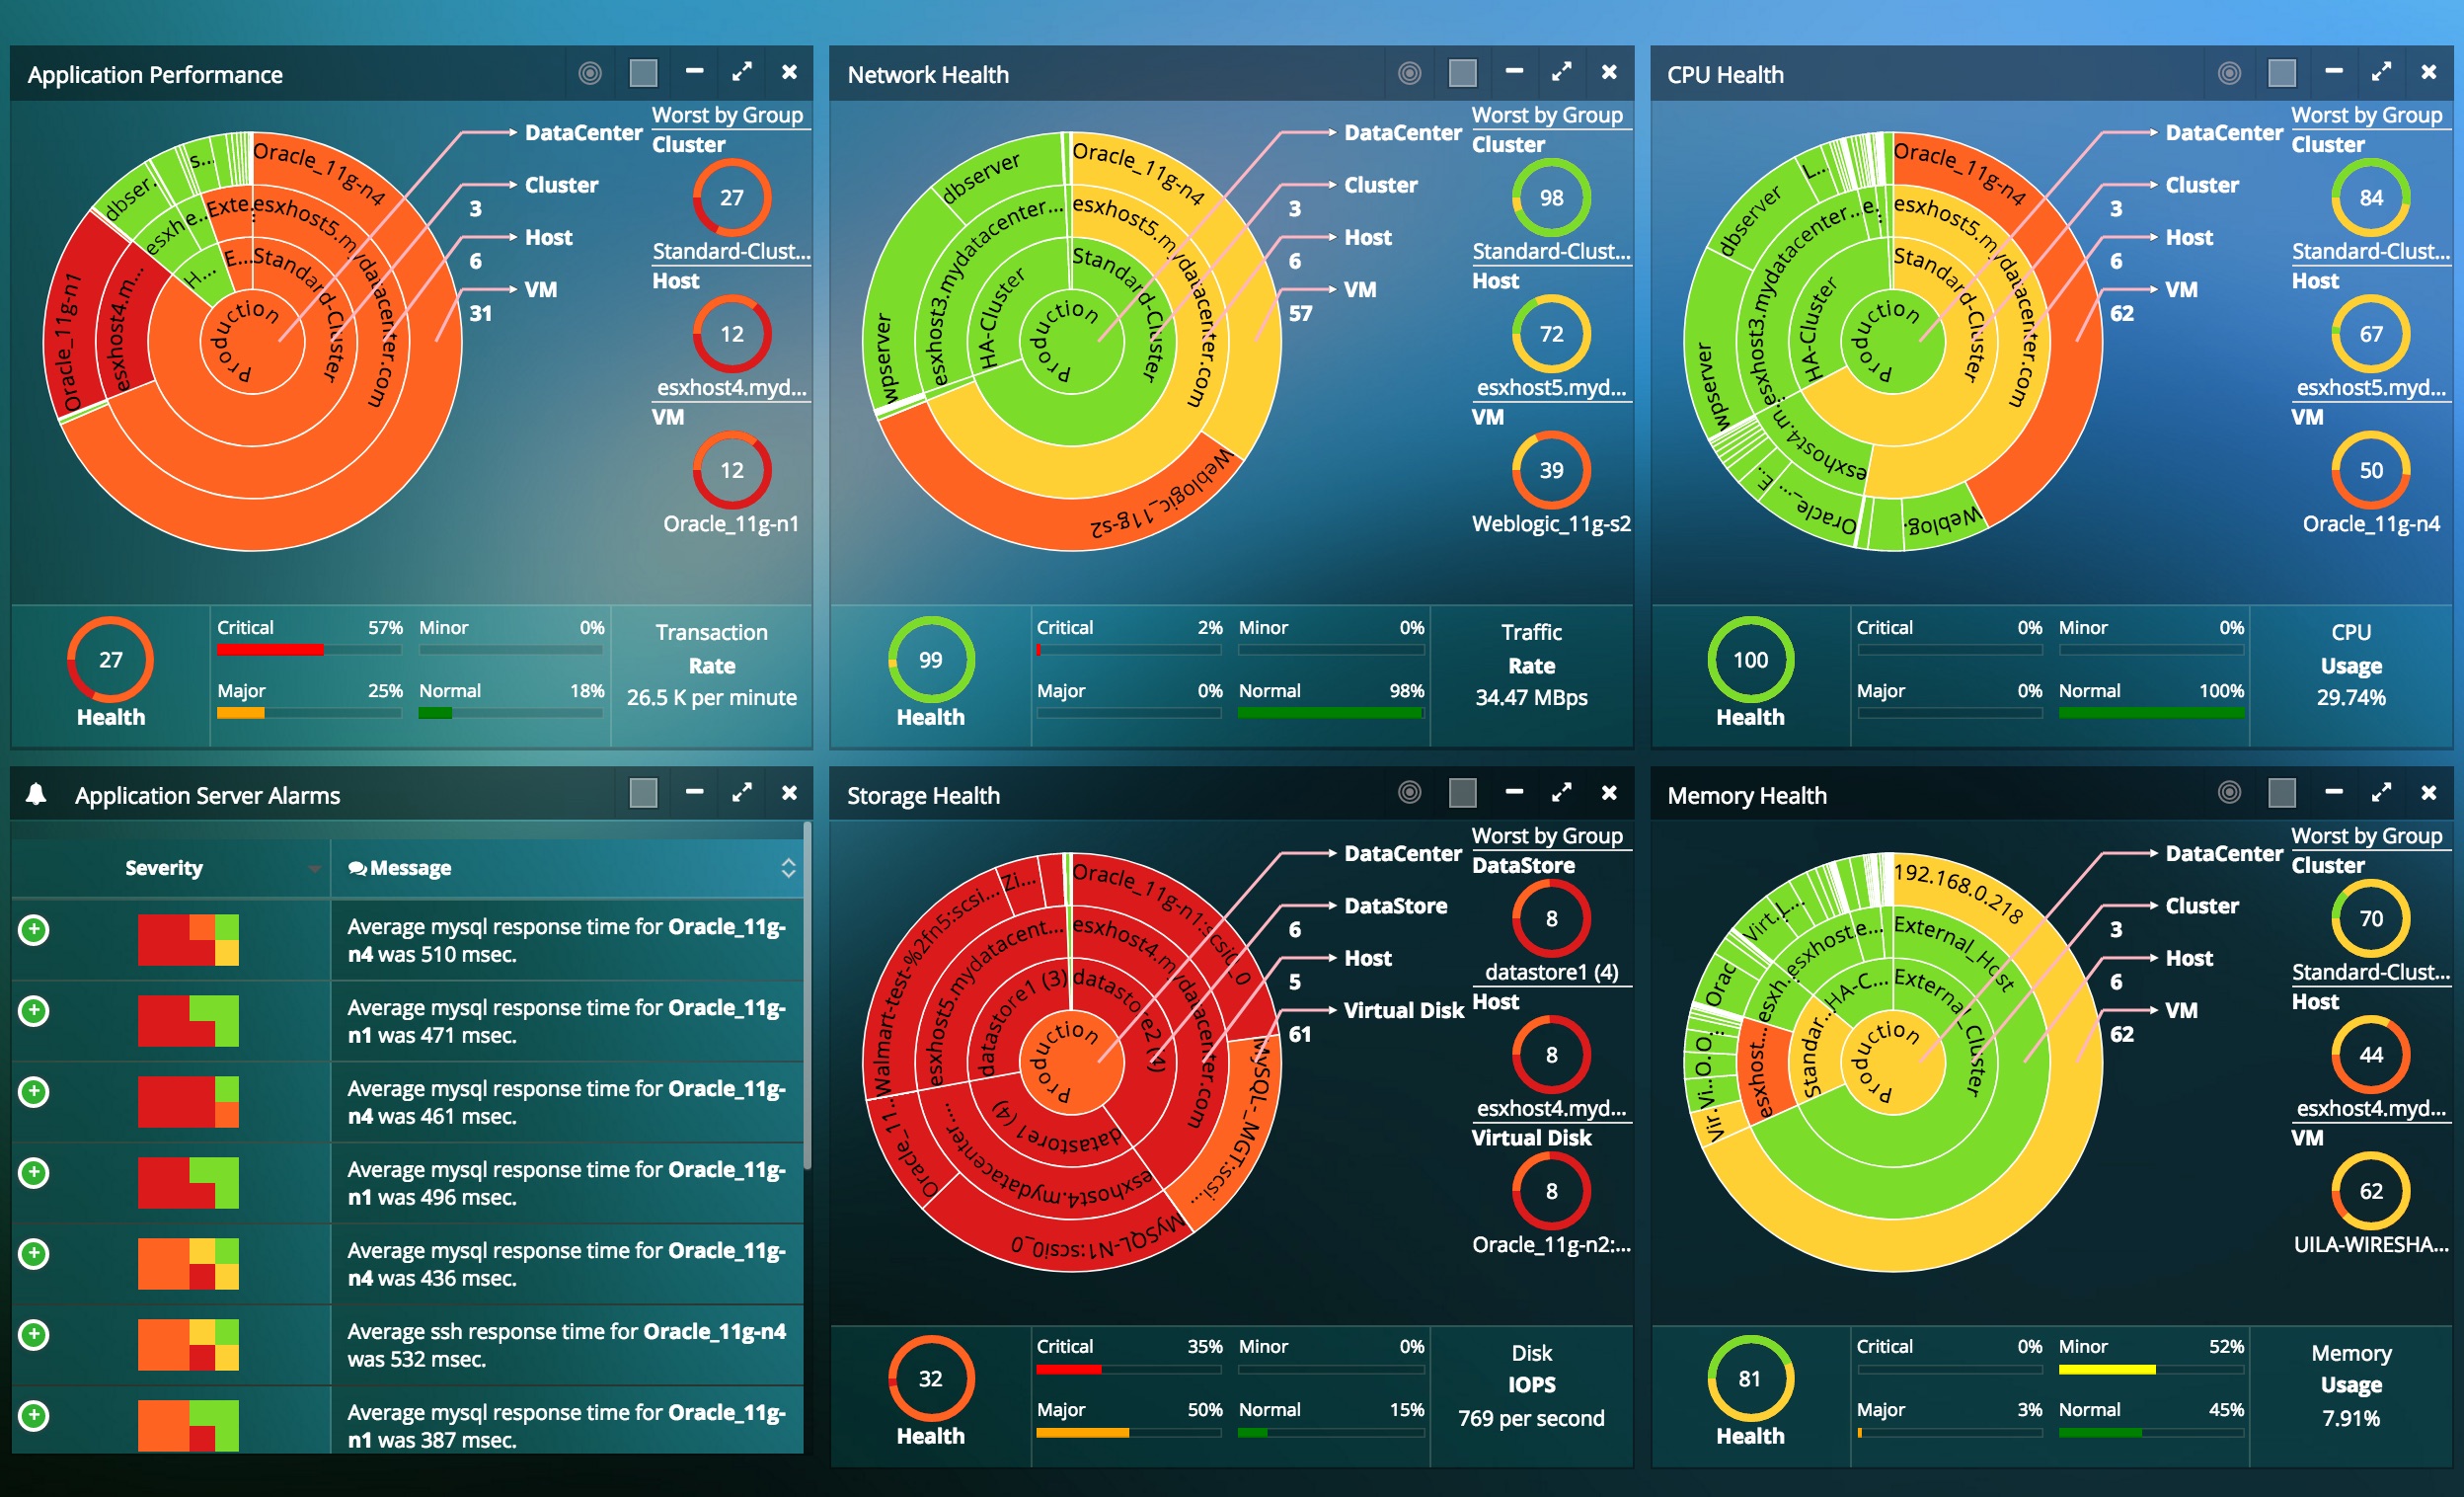
The view includes customizable dashboards and end-to-end coverage in a single pane. You’re able to drill into the details seemingly endlessly to troubleshoot any issues that may occur. This is the true power of data collection; being able to visualize raw data into actionable information. Being able to do this across your on-premises datacenter, as well as public and hybrid cloud environments, not only helps you with troubleshooting and proactive resolution, but also keeps an inventory of your entire footprint. For an admin, a tool like this is long overdue, and we’re stoked to be able to make your lives easier with it. The view from here is fine.
Check out these customer testimonials to see how Uila changed their lives in the datacenter!
Interested in learning more? Click here to try the live interactive demo right here on our website!
Subscribe
Latest Posts
- How Data Center System Administrators Are Evolving in today's world
- Microsoft NTLM: Tips for Discontinuation
- Understanding the Importance of Deep Packet Inspection in Application Dependency Mapping
- Polyfill.io supply chain attack: Detection & Protection
- Importance of Remote End-User Experience Monitoring
- Application and Infrastructure Challenges for Utility Companies
- Troubleshooting Exchange Server Issues in Data Centers
- Importance of Application Dependency Mapping for IT Asset Inventory Control
- Navigating the Flow: Understanding East-West Network Traffic
- The imperative of full-stack observability


