Agentless & Seamless Discovery for over 4,200 applications
- Application auto-discovery for over 4,200 applications with deep packet inspection.
- Review Application Response times, Transaction volume and Traffic volume for each individual application without interfering with their existing processes and services.
- Automated DPI to classify previously unknown traffic using embedded machine-learning algorithms.
- IT teams can identify blind spots in the infrastructure, and eliminate finger pointing between infrastructure and application teams with automated root cause and forensics.
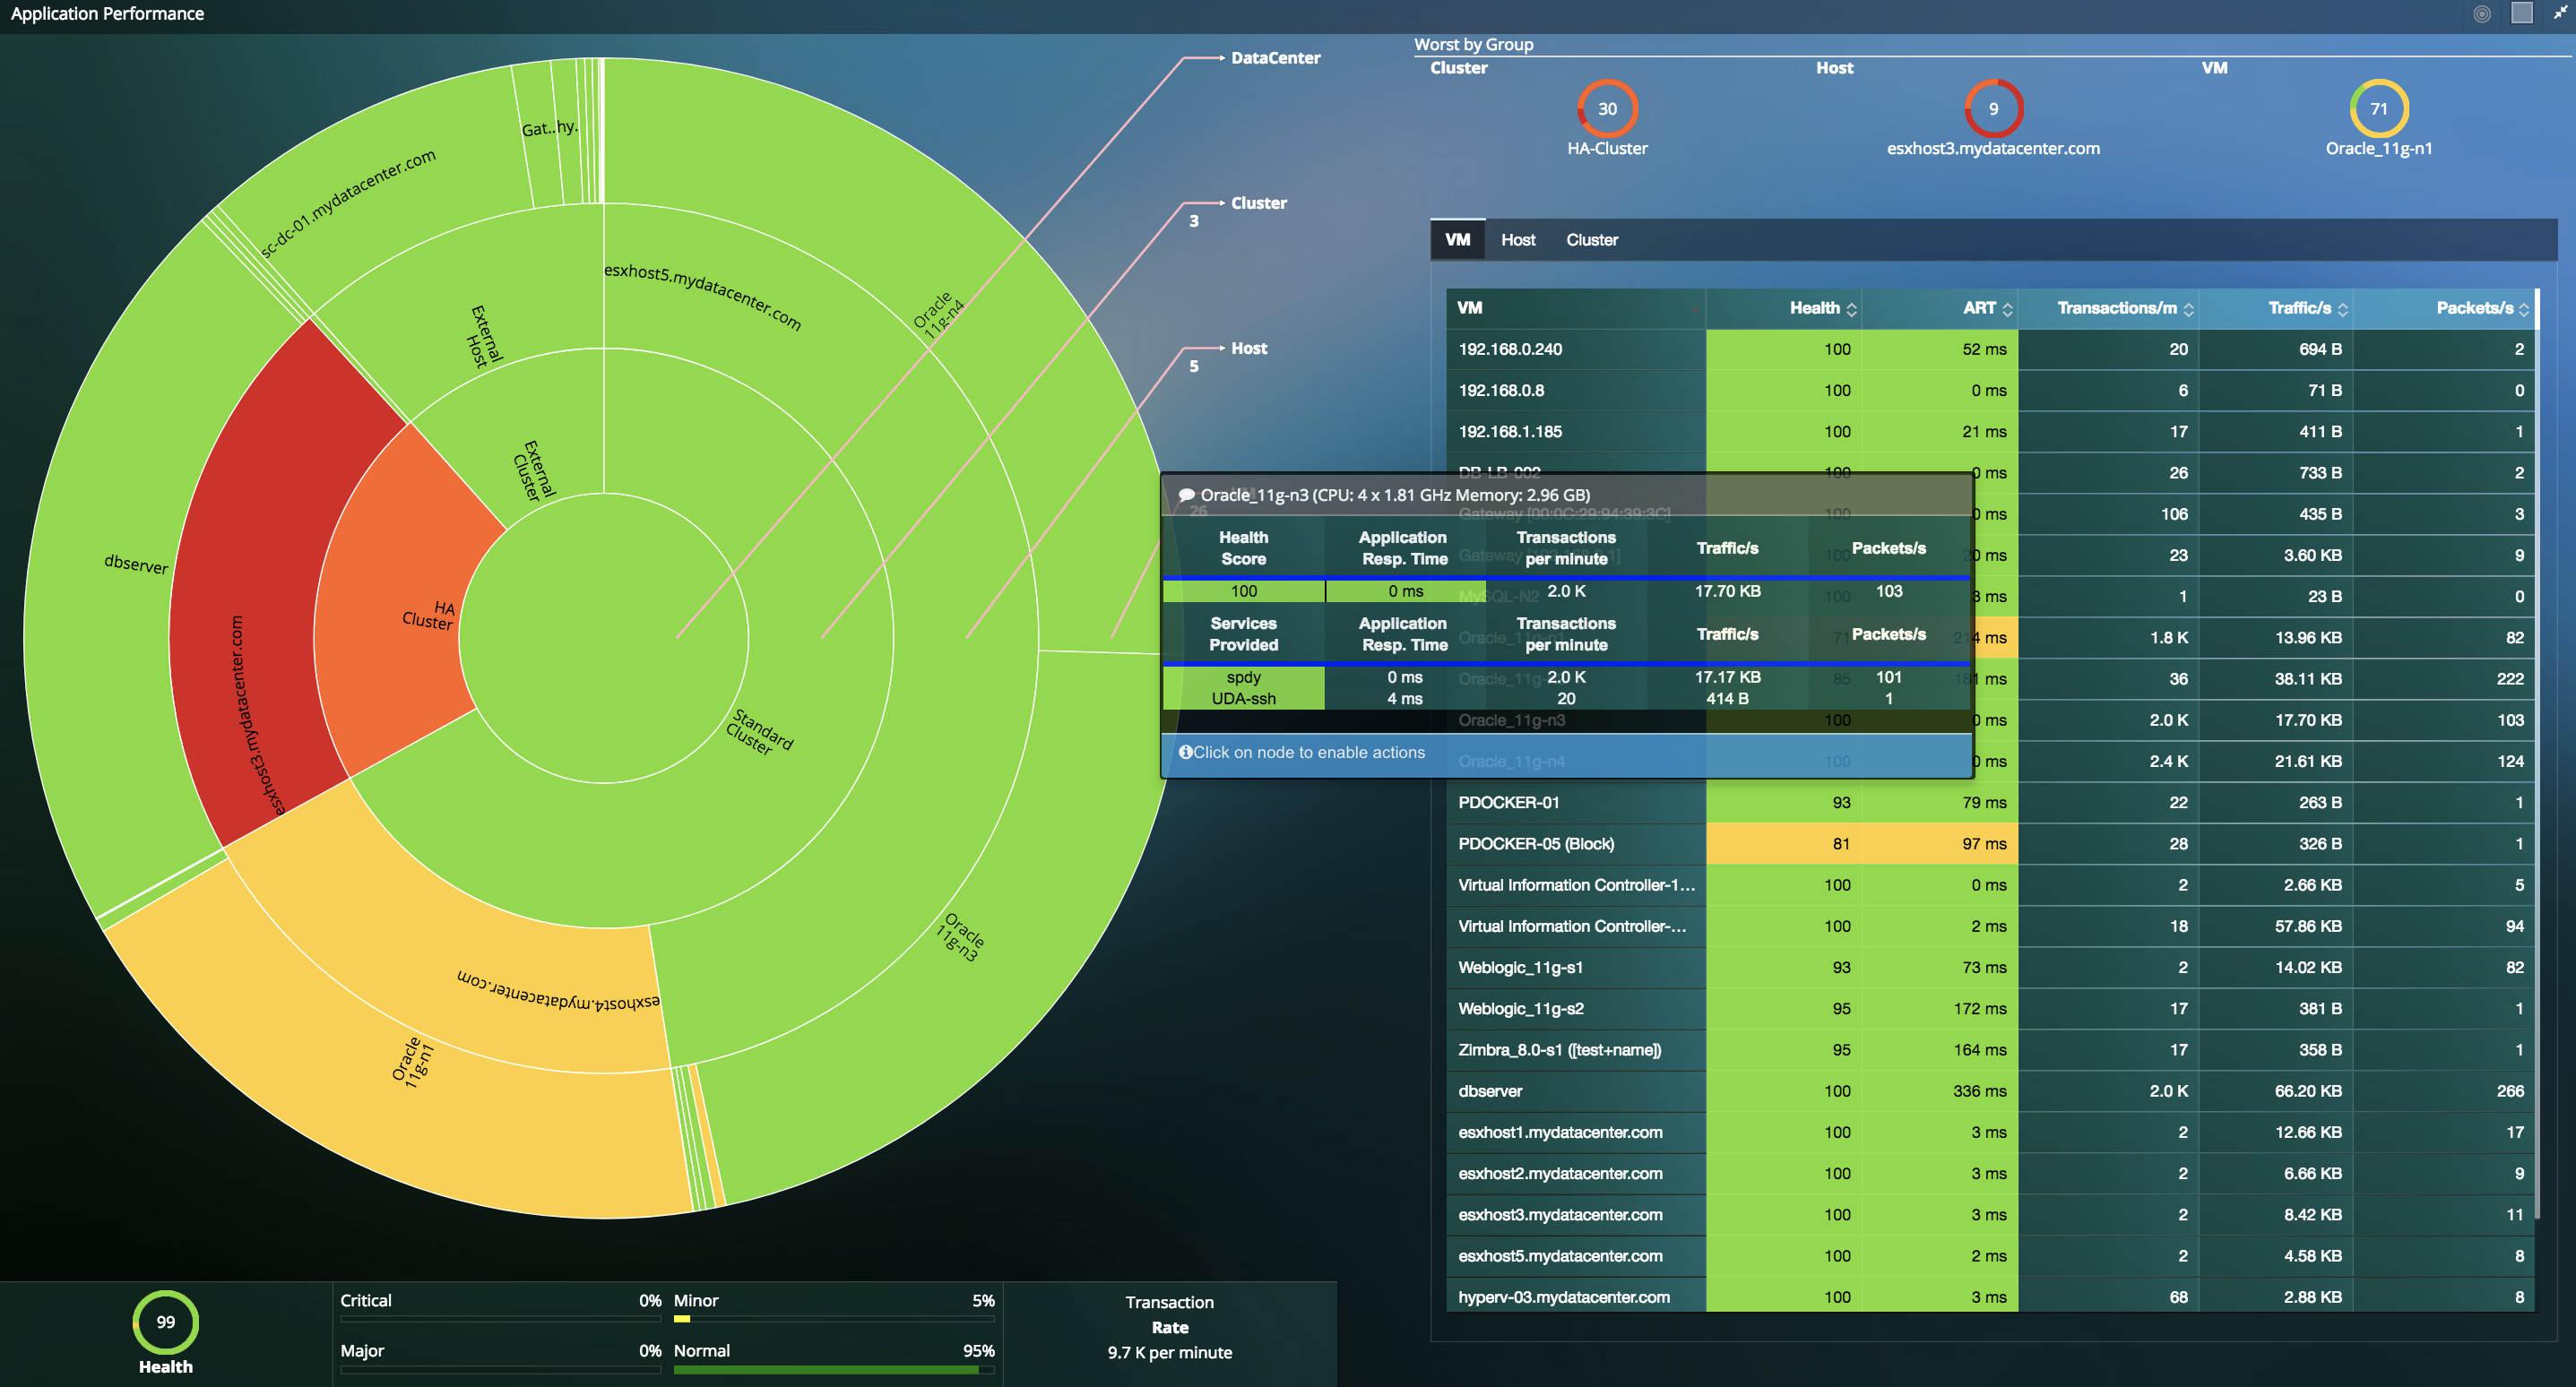
Correlate Application & Infrastructure Performance
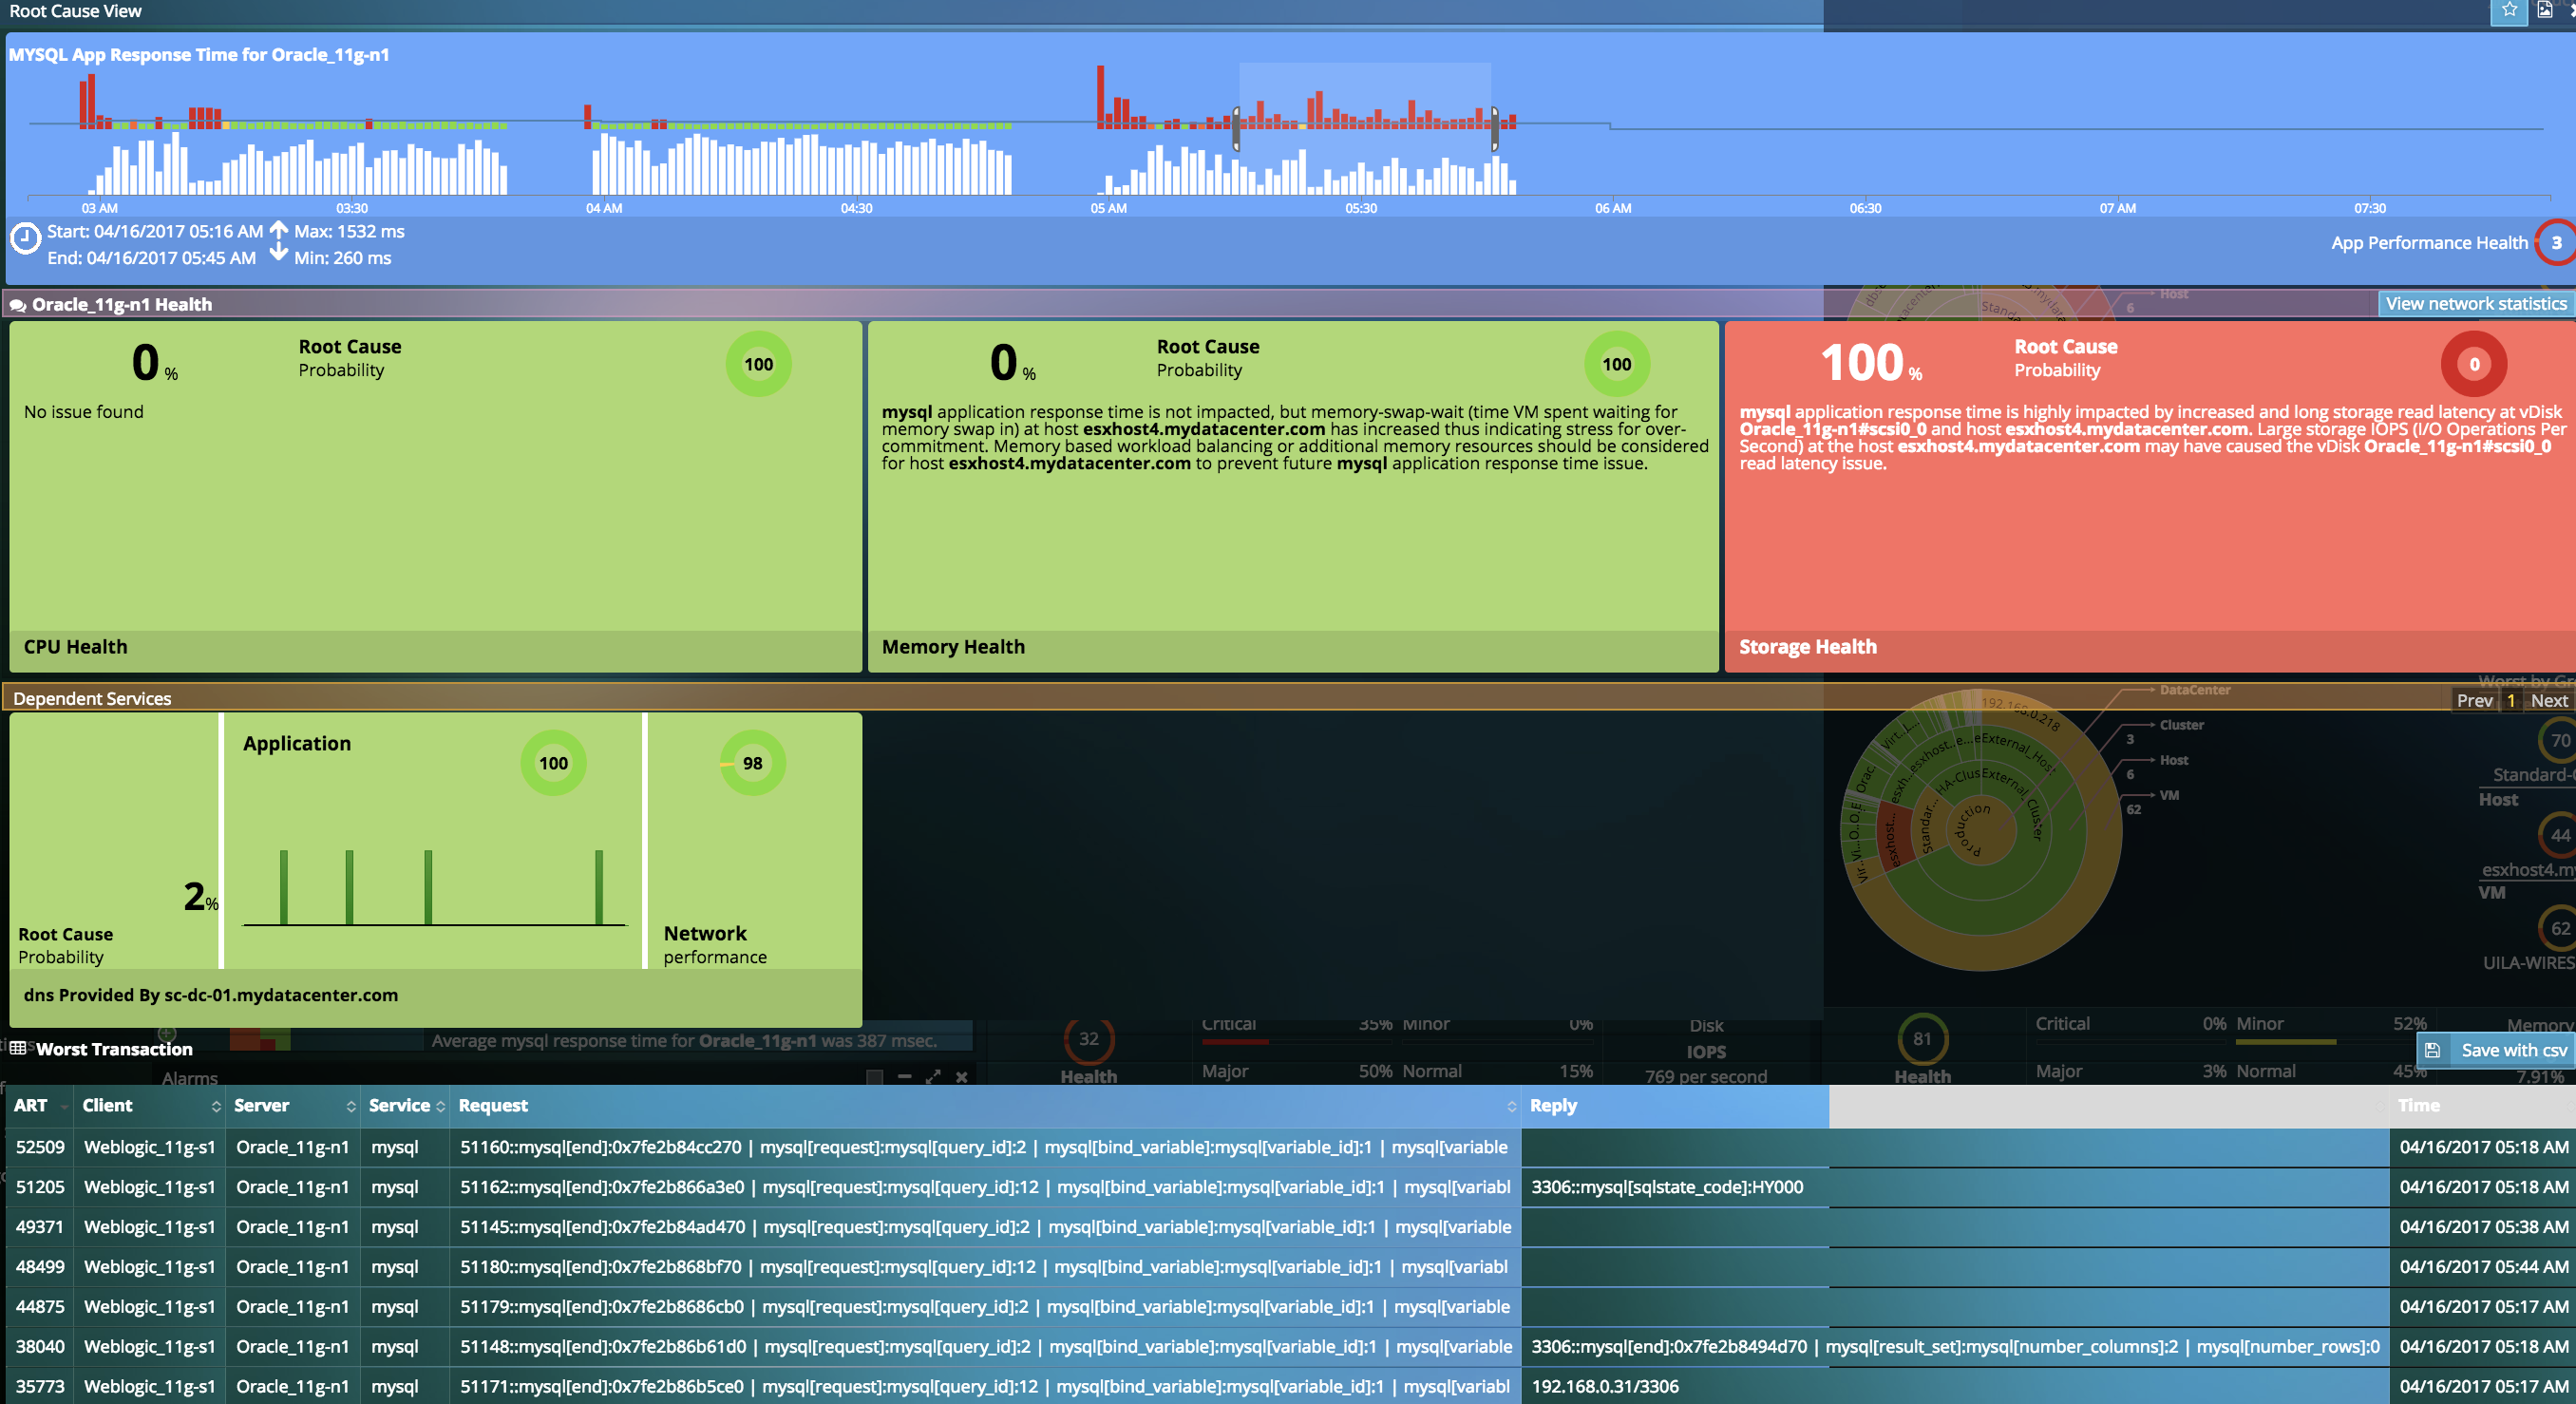
- Automatically correlate any Application Performance issues with underlying network, storage and compute performance to get to root-cause.
- Isolate Application Performance issues by monitoring Application Response Time (ART) for any multi-tiered application.
- Keep your teams focussed on improving the Application Performance, instead of costly and stressful war-room conversations.
Real-time visibility into Application & Business Service Dependencies
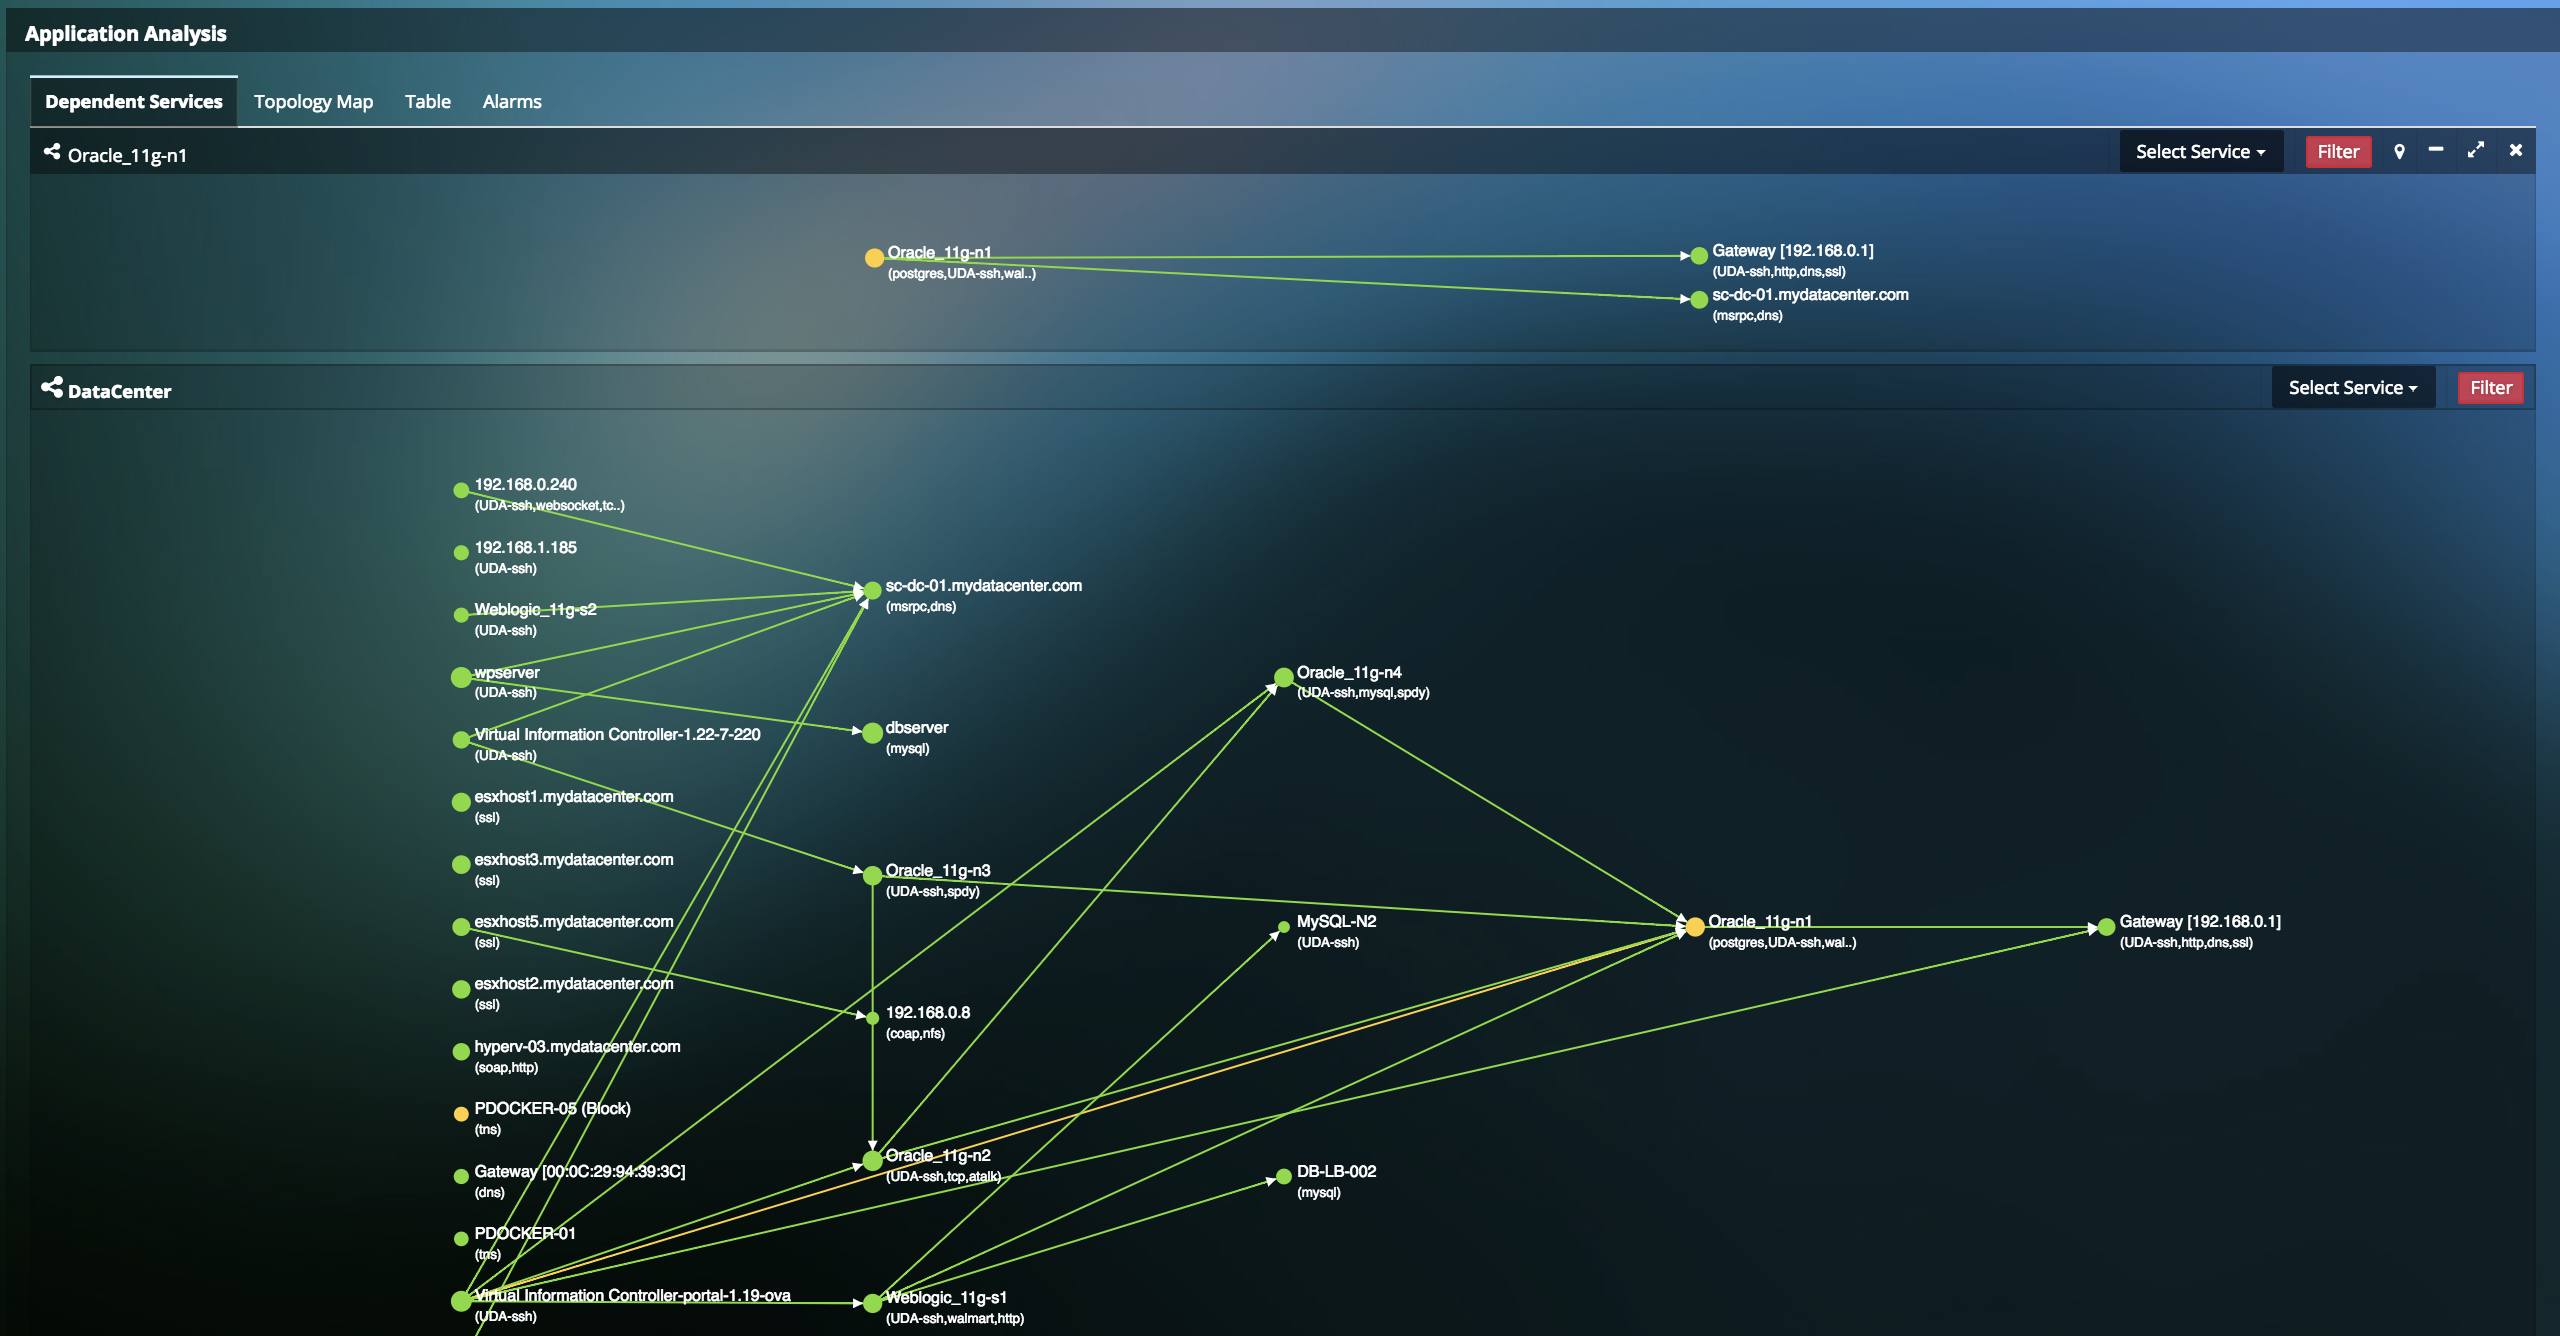
- Application dependency mapping generates an intuitive topology map for multi-tier application insights for reducing MTTR.
- Application dependency and topology mapping provides critical insight for defining Migration & Disaster recovery Strategies.
Deeper Intelligence for Applications
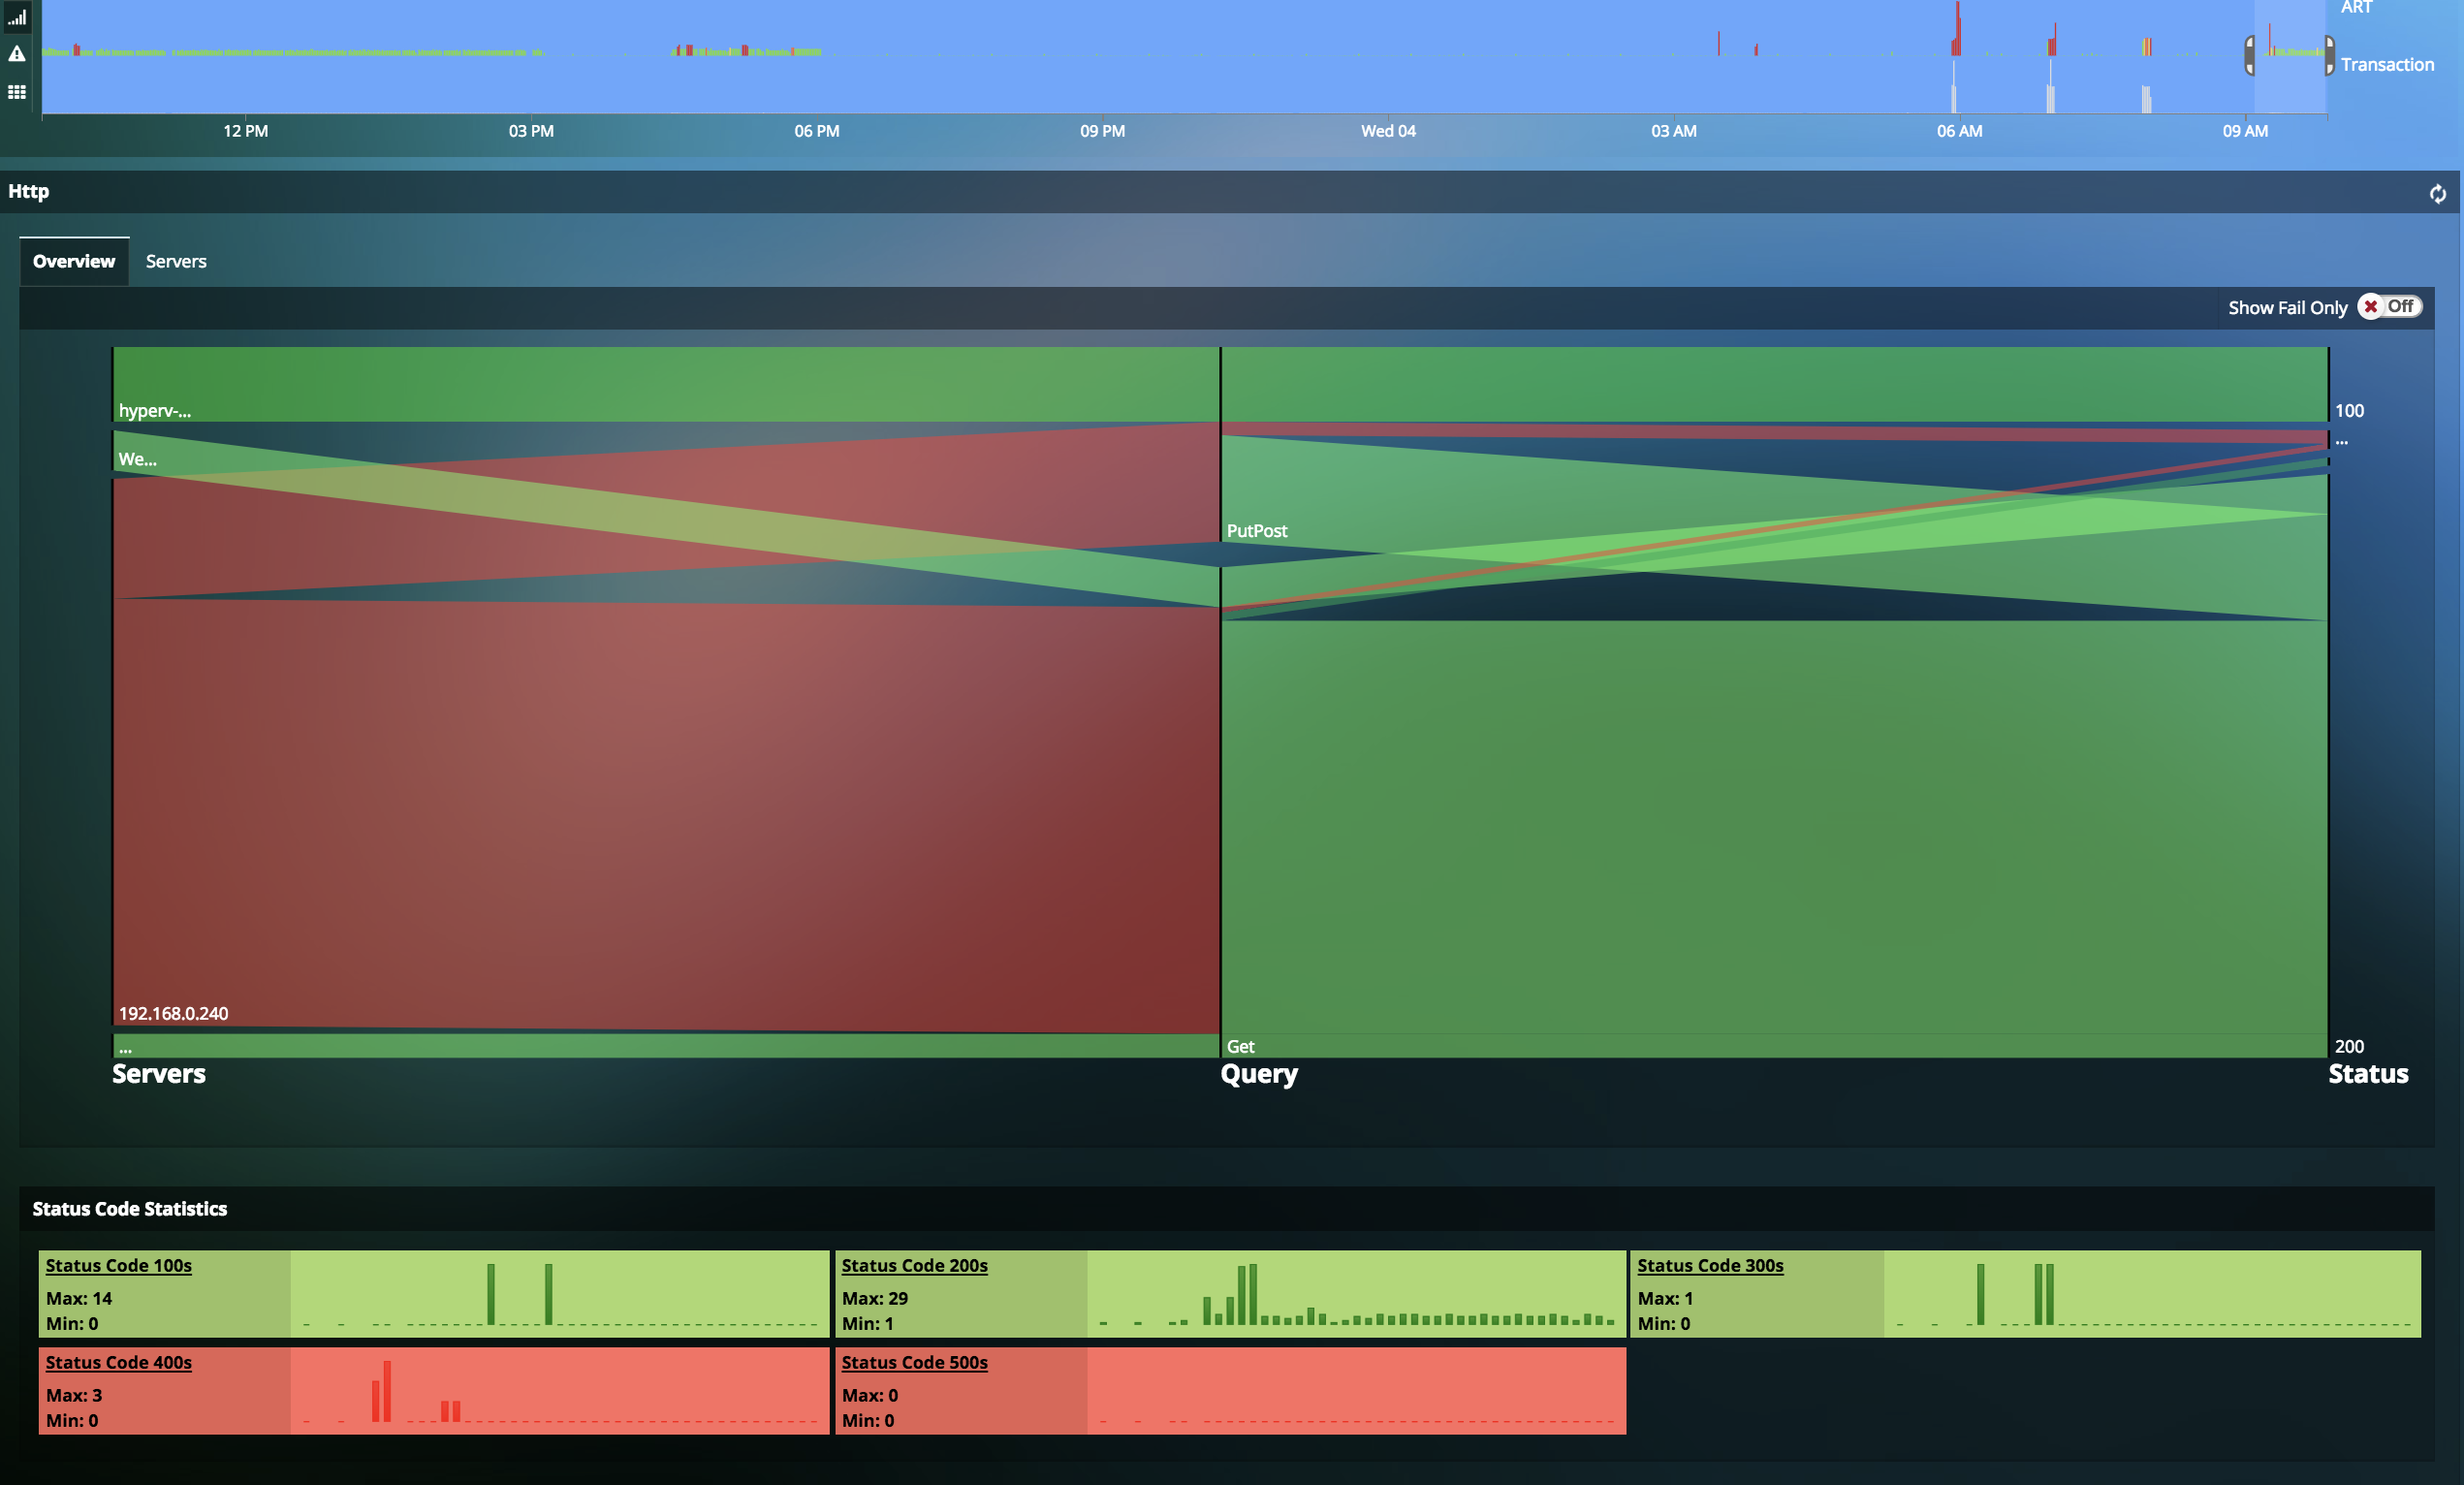
- Uila provides deep insights into web and database applications (MS-SQL, PostgreSQL, DNS, HTTP, MySQL and Oracle) to allow for the issues to be narrowed down and mitigated.
- Detailed Query and Network Statistics –ART, queries (GET, POST, HEAD) and network related transactions & Status code statistics –number of status code requests and responses collected per minute.
- Search Engine for Application Transaction Metadata.
Mission-Critical Business Service Observability
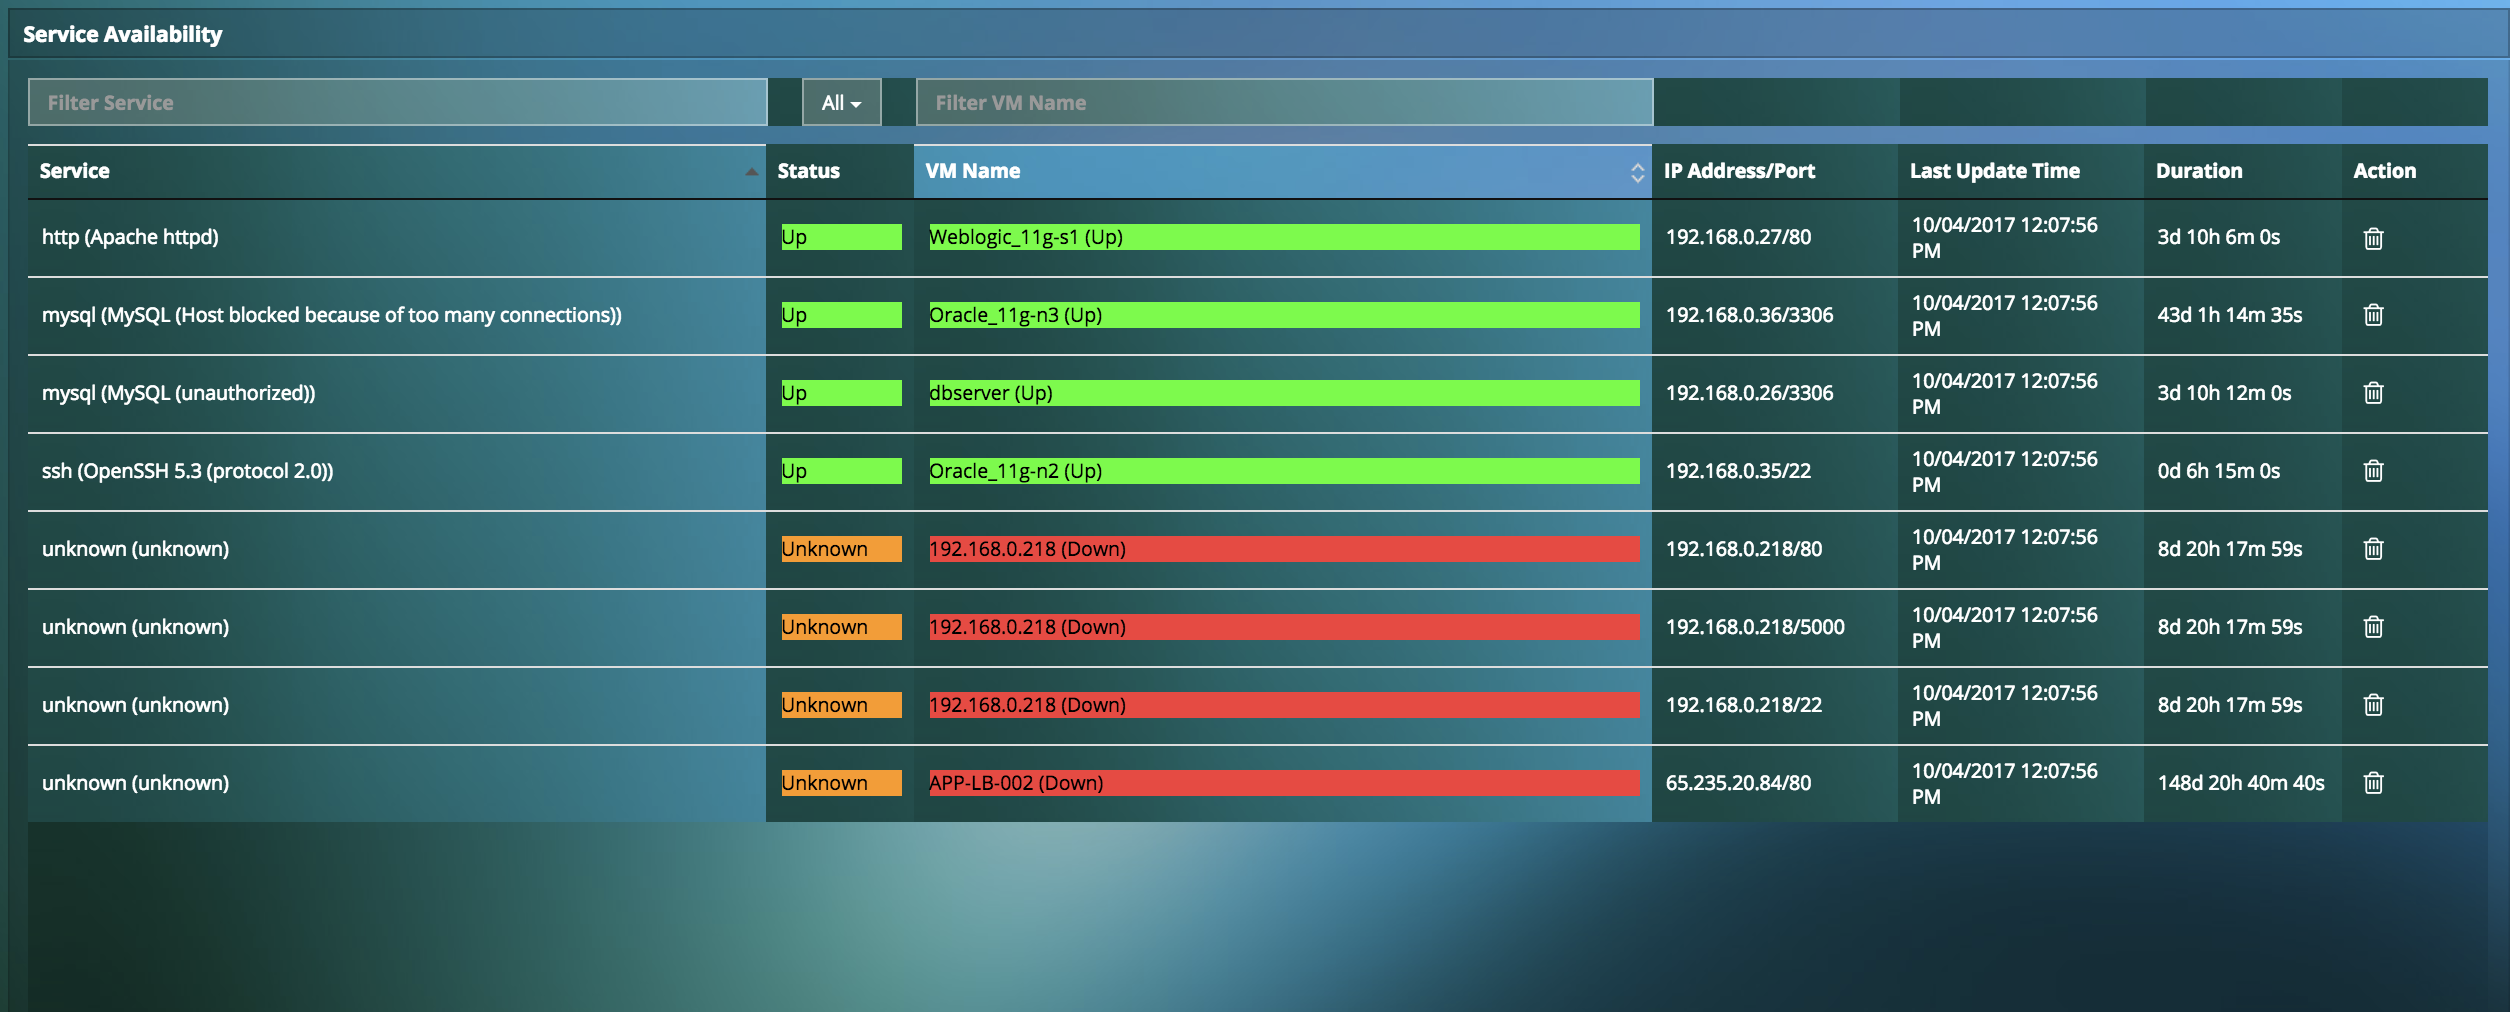
- Quickly isolate status of mission-critical services and its virtual machines, ensuring the datacenter to achieve high availability across the board.
- Get status of the service along with uptime to ensure all systems and ports of a critical VM are up and functional.
End-User Business Service Assurance
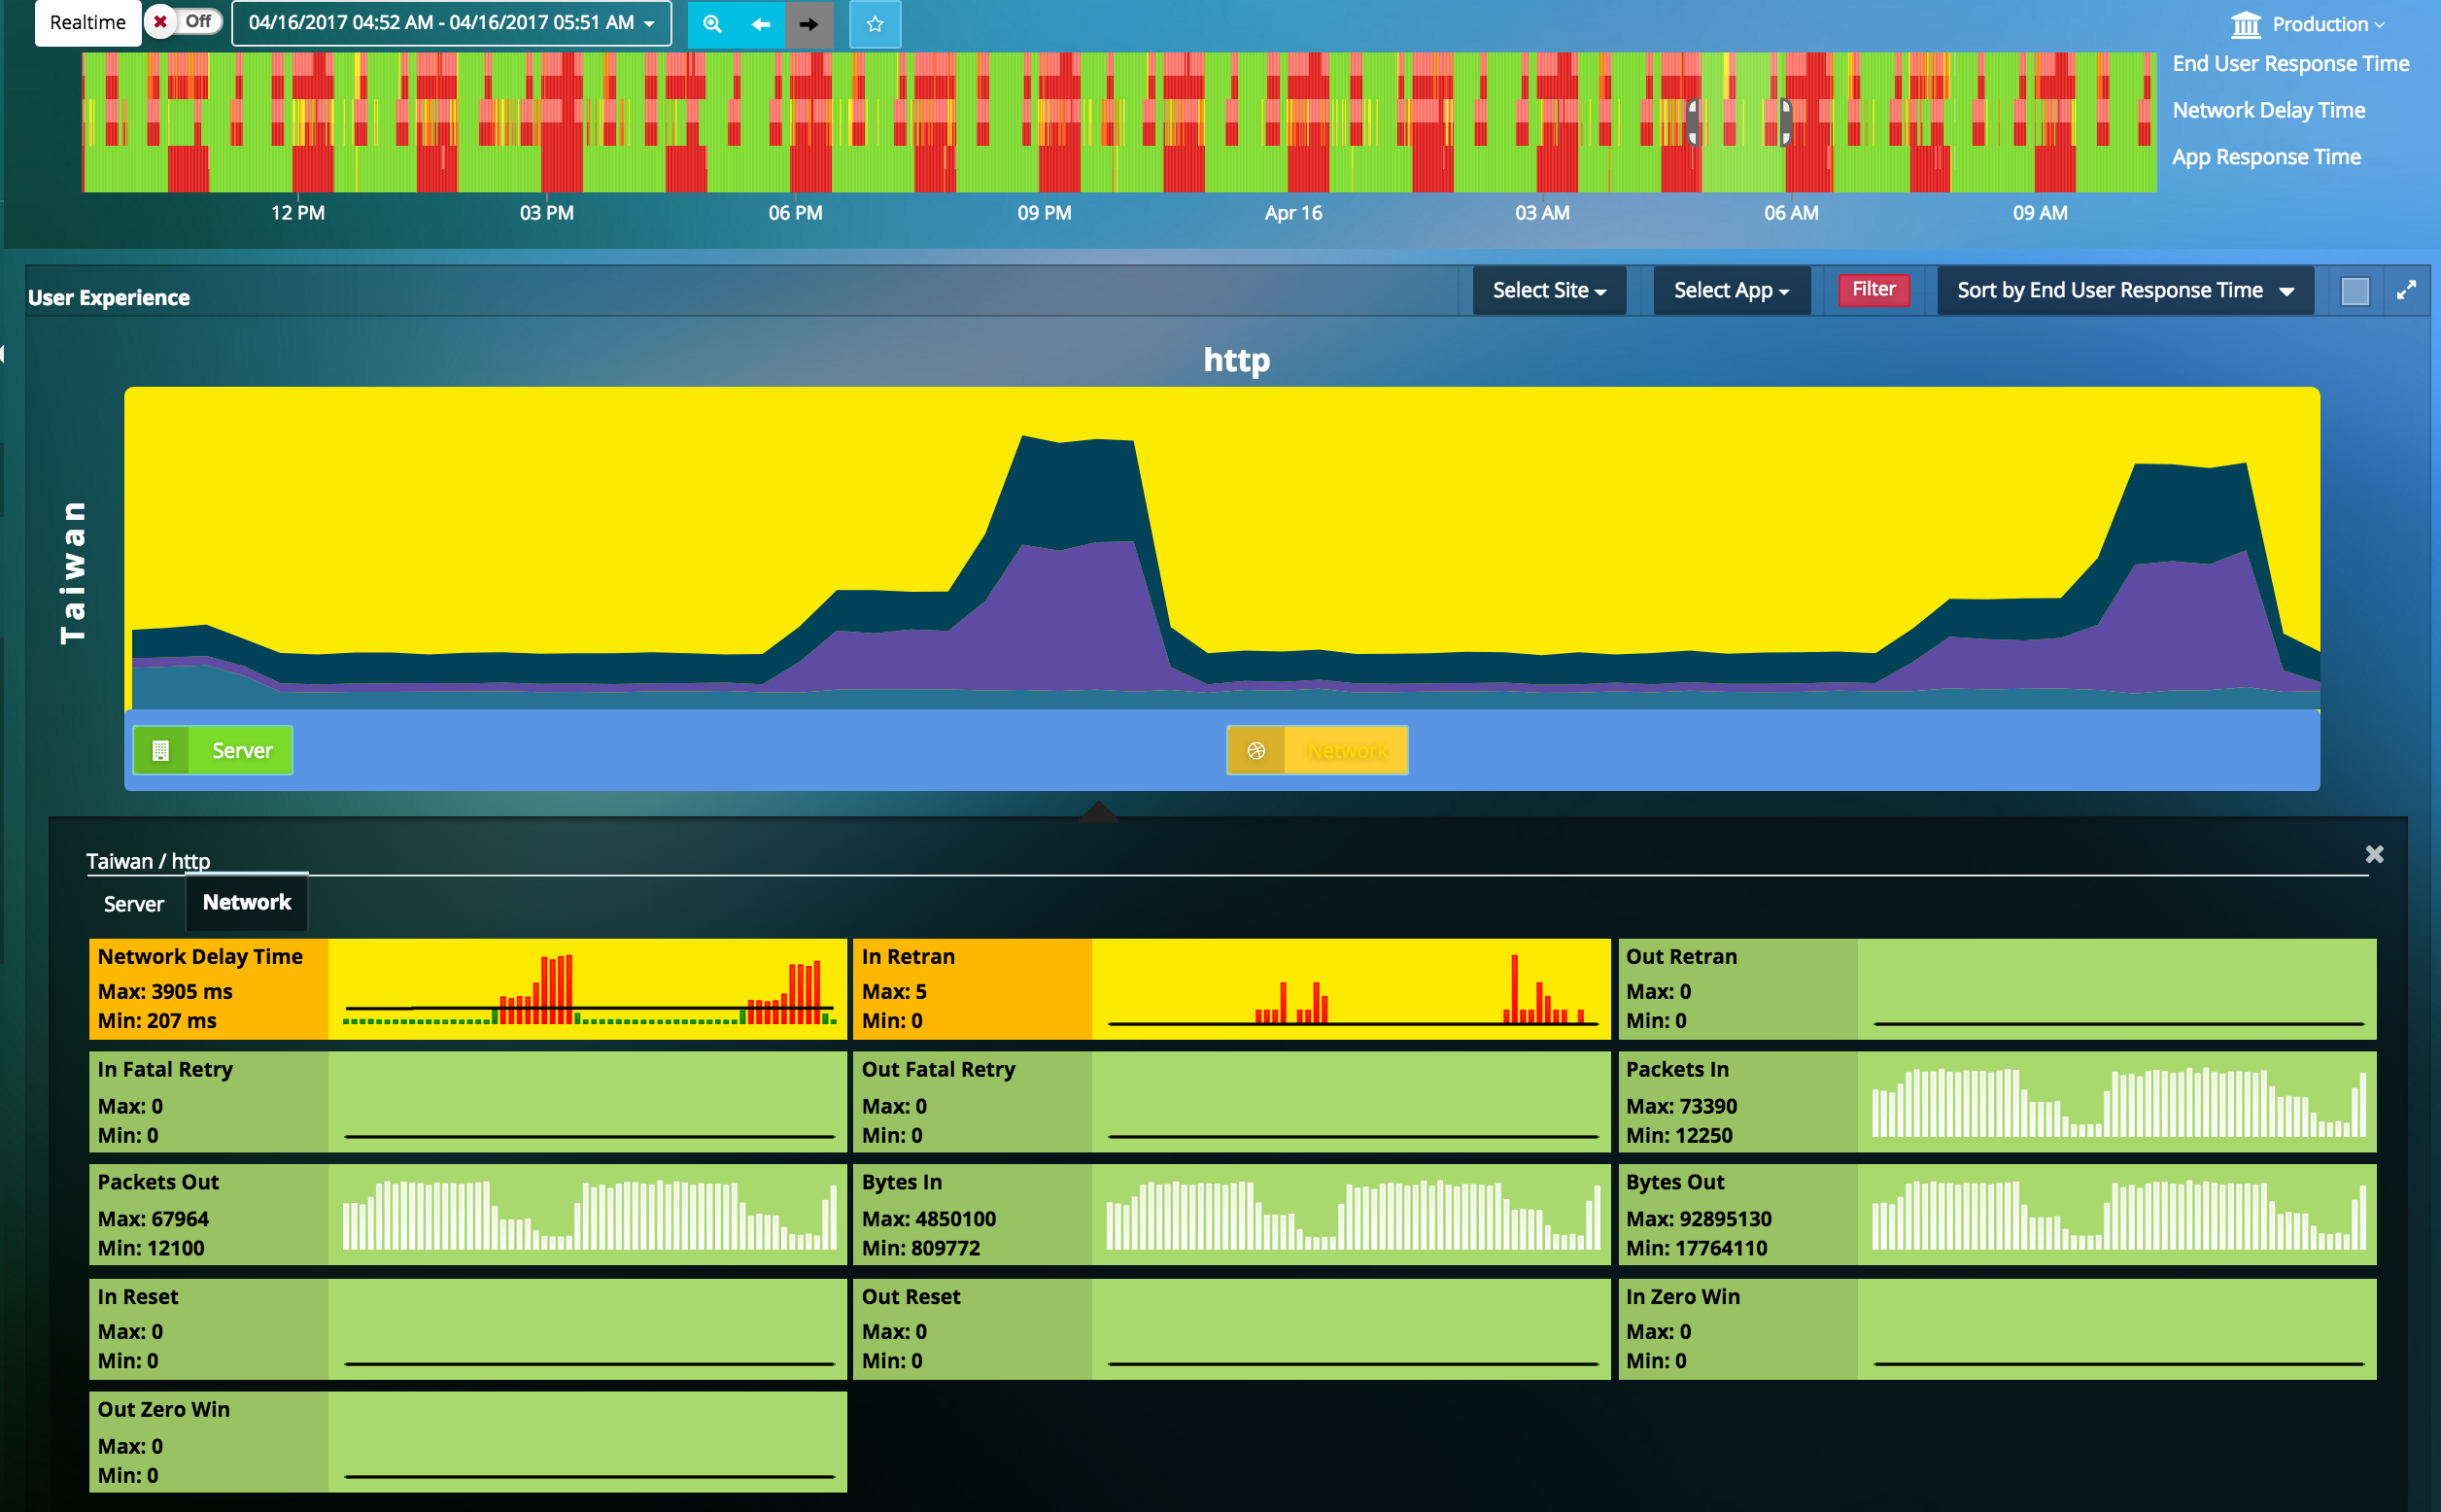
- End user response time tracking proactively alerts IT to service degradation from the user's perspective.
- Response time analysis breaks down delays by the server, network, storage, application and clients.
- Site-by-site and client-by-client analysis isolates and correlates user issues to the real root cause, thus speeding up troubleshooting time.
Actionable Alerts for Issues that impact user performance: Stop staring at dashboards to catch problems
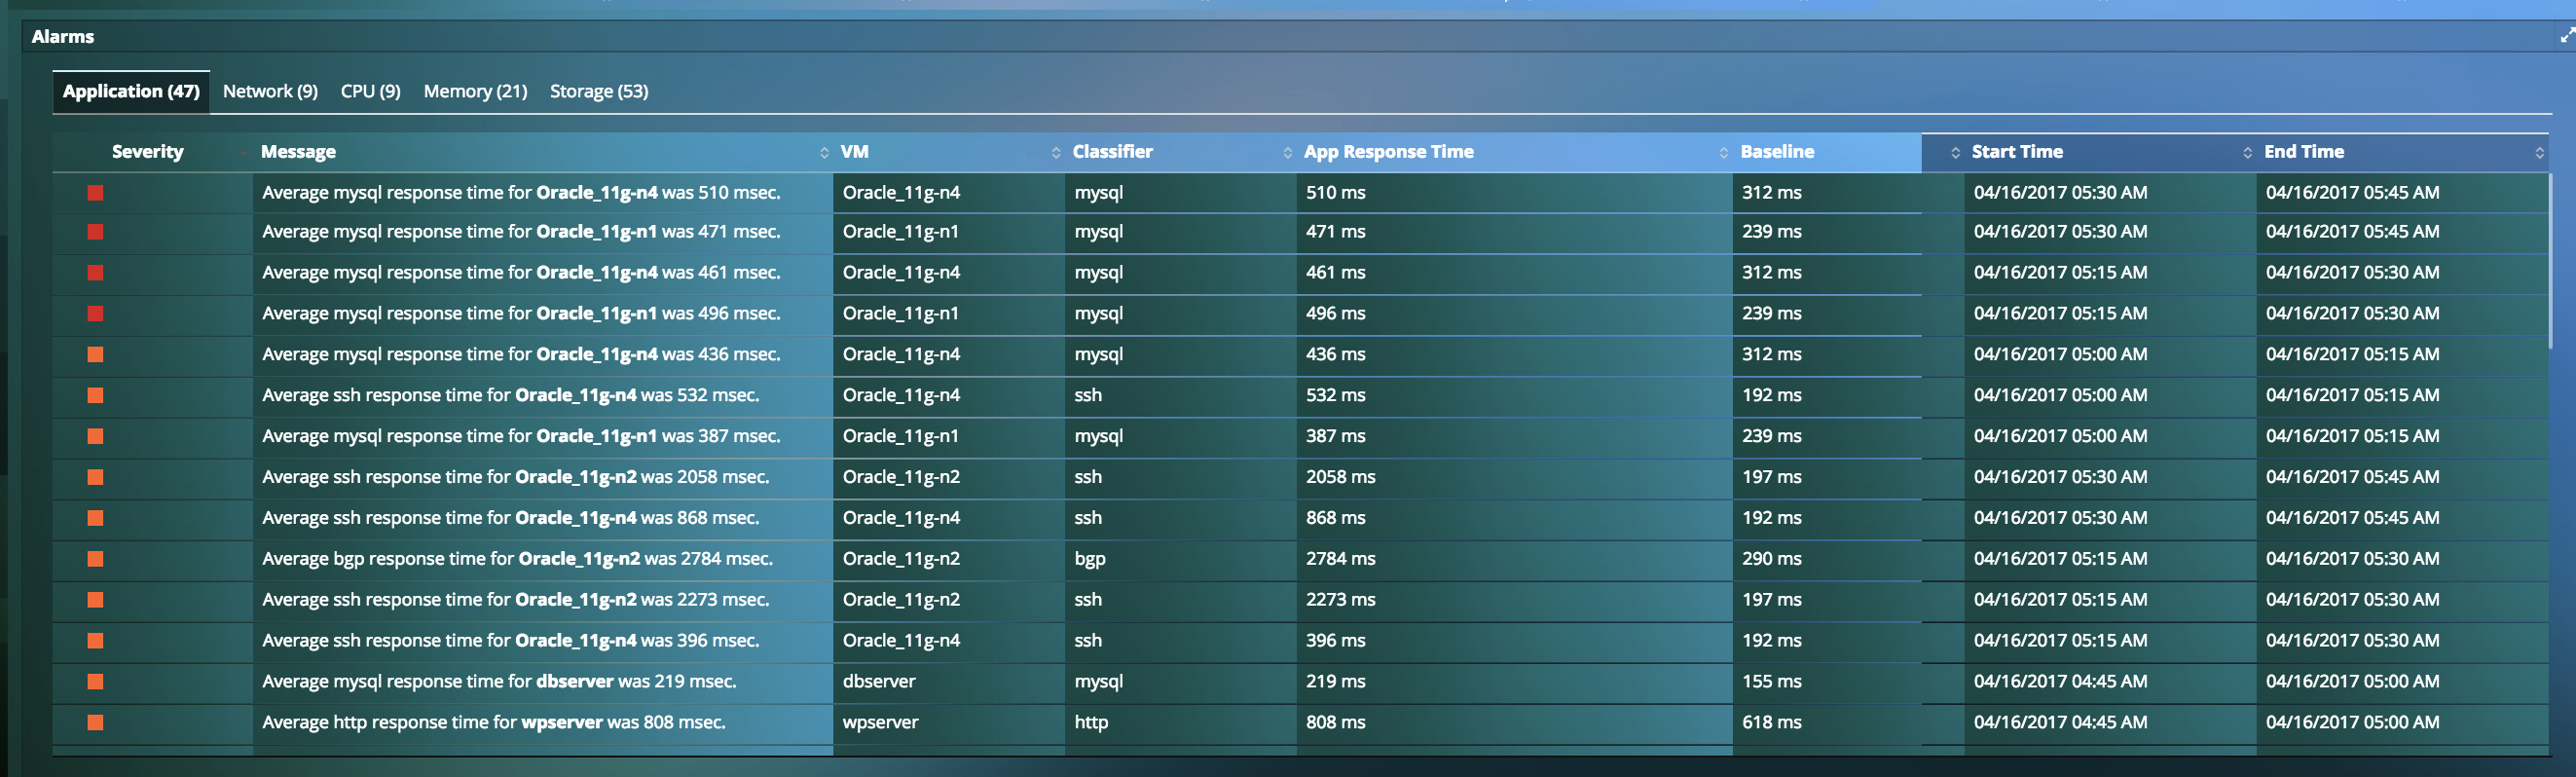
- Intelligent IT Monitoring alerts on Application, Infrastructure and Network issues impacting your business transactions.
- Real-time configurable threshold alerting.
- Automatically identify abnormal changes with Dynamic performance baselining.
- Get automated email, syslog, SNMP alerts or send alerts to a Zabbix system.
Full Stack Observability in a Single Product
- Align business and IT Operations goals in a single product with application visibility and correlated network, compute and storage insights
- Full stack visibility (Application Performance Monitoring, Infrastructure Performance Monitoring, Network Monitoring, Storage Monitoring) for virtualized data centers reduces troubleshooting time from days to minutes, enabling lean IT teams to get time back for more strategic projects
- Identify blind spots in the infrastructure, and eliminate finger pointing between infrastructure and application teams with automated root cause and forensics.
Resources
-
Uila real world use case: Resolving DNS error issuesQuick video on how an enterprise organization resolved their DNS error issues.
-
Uila real world use case: Resolving Application issues due to Database challengesQuick video on how an IT team resolved Application issues for their intranet file/document sharing application due to Database challenges.
-
Change control monitoring with UilaQuick product video on how to use Uila for change control monitoring in applications and their dependencies in the modern data center.
-
Application Performance Monitoring with UilaQuick product video on how to use Uila for Application Performance Monitoring.
-
Hospitality Management Company Eliminates any Impact to the Venue Revenue with UilaHospitality Management company solves Delphi Software performance issues and eliminates any impact to their venue revenue with Uila.
-
Multinational Telecommunications company Success StorySuccess Story for a top US-based Multinational Telecommunications Company where Uila helped their R & D division shorten the development cycle and reduce MTTR for issues by over 40%.
-
Construction Equipment Dealer Success StorySuccess Story for Construction Equipment Dealer where Uila helped them solve the problems with their business critical CRM server, and eliminated past downtimes that impacted customer relationships, pricing and record information.
-
Carolina Biological Success StoryWatch how Uila helped Carolina Biological resolve their Application slowdown complaints.
-
Multinational Electronics Conglomerate Success StorySuccess Story for a Multinational Electronics Conglomerate where Uila helped their IT team solve their Application Performance Problems.
-
Welcome to DevOps and the Era of the ApplicationRead blog on Devops and the era of the application.
-
The Gorilla Guide to... Application-centric IT for Private and Hybrid CloudIn this ebook, you will learn about the advantages of an application-focused approach to IT; Discovery of Application Dependencies to simplify workload migration and resource planning; How to start the journey of developing a "full stack" mindset for managing applications.
-
Application Transaction Analysis with UilaOverview of Application Transaction Analysis for deep insights into web and database applications (MS-SQL, DNS, HTTP, MySQL and Oracle) to allow for the issues to be narrowed down and mitigated.
-
Monitoring your Mission Critical Applications with UilaVideo on how to monitor your mission critical applications with Uila's Service Grouping and Service Availability features.
-
End-User Experience Monitoring with UilaQuick video on how Uila can be used to see problems from the end user’s point of view, identify root cause, and proactively fix the problems -- often before users even notice.
-
What is Application-centric IT?Uila CEO Chia-Chee Kuan talks about Application-Centric IT.
-
2017 Next-gen Software-defined (SDx) Infrastructure Assurance ReportUila featured in the 2017 Next-gen Software-defined (SDx) Infrastructure Assurance Analyst Report
-
White Paper on Managing Application-centric IT for Hybrid CloudHybrid Cloud and the impact on monitoring solutions with the shift in IT Landscape from Infrastructure-centic to Application-centric by Edwin Yuen, Analyst @ ESG
-
Things Application Performance Monitoring can't tell youRead Blog from Uila CEO on visibility gaps with APM solutions.
-
GDS Case StudyUila helps GDS deliver IaaS service with greater levels of customer visibility and satisfaction
Ready to begin your Monitoring Journey with Uila?
Start a 21-day Free Trial Now
Request Trial


