Hyperconvergence in the Modern Data Center
-
Hyperconvergence maybe defined in different ways by different vendors, organizations or IT folks. But to put in a simple statement, it basically calls for the convergence of different platforms (Compute, Storage and at times even Network) into a single platform that is managed from a single interface.
- Management efficiency for configuration, management and troubleshooting.
- High Availability on both, Compute and Storage.
- Hyper and easy Scalability with shared resource pools, that allows easy addition of nodes to scale as per the requirements.
- Reduced costs with shared pools, instead of separate ones. For example, this could elimiate separate support and maintenance contracts.
Uila is currently validated as Nutanix Ready (Core and AHV Integrated). These badges ensure that Uila has been tested and verified to work in the Nutanix environment. Uila is supported on the Nutanix Cloud Platform running VMware ESXi and Nutanix AHV for Prism Central.
With Hyperconverged Infrastructure deployments, organizations can derive many benefits. These include:
Full Stack Observability in a Single Product for HCI Environments like Nutanix Cloud Platform
- Align business and IT Operations goals in a single product with application visibility and correlated network, compute and storage insights to solve problems before end-user impact in a Hyperconverged Infrastructure environment.
- Reduce time in War room conversations and instead focus on business acceleration projects.
- Full stack Observability (Application Performance Monitoring, Infrastructure Performance Monitoring, Network Monitoring, Storage Monitoring) for virtualized data centers reduces troubleshooting time from days to minutes, enabling lean IT teams to get time back for more strategic projects
- Identify blind spots in the infrastructure, and eliminate finger pointing between infrastructure and application teams with automated root cause and forensics.
Read more about full-stack monitoring with Uila by clicking the button below:
Full-Stack Monitoring
Real-time visibility into Application & Business Service Dependencies
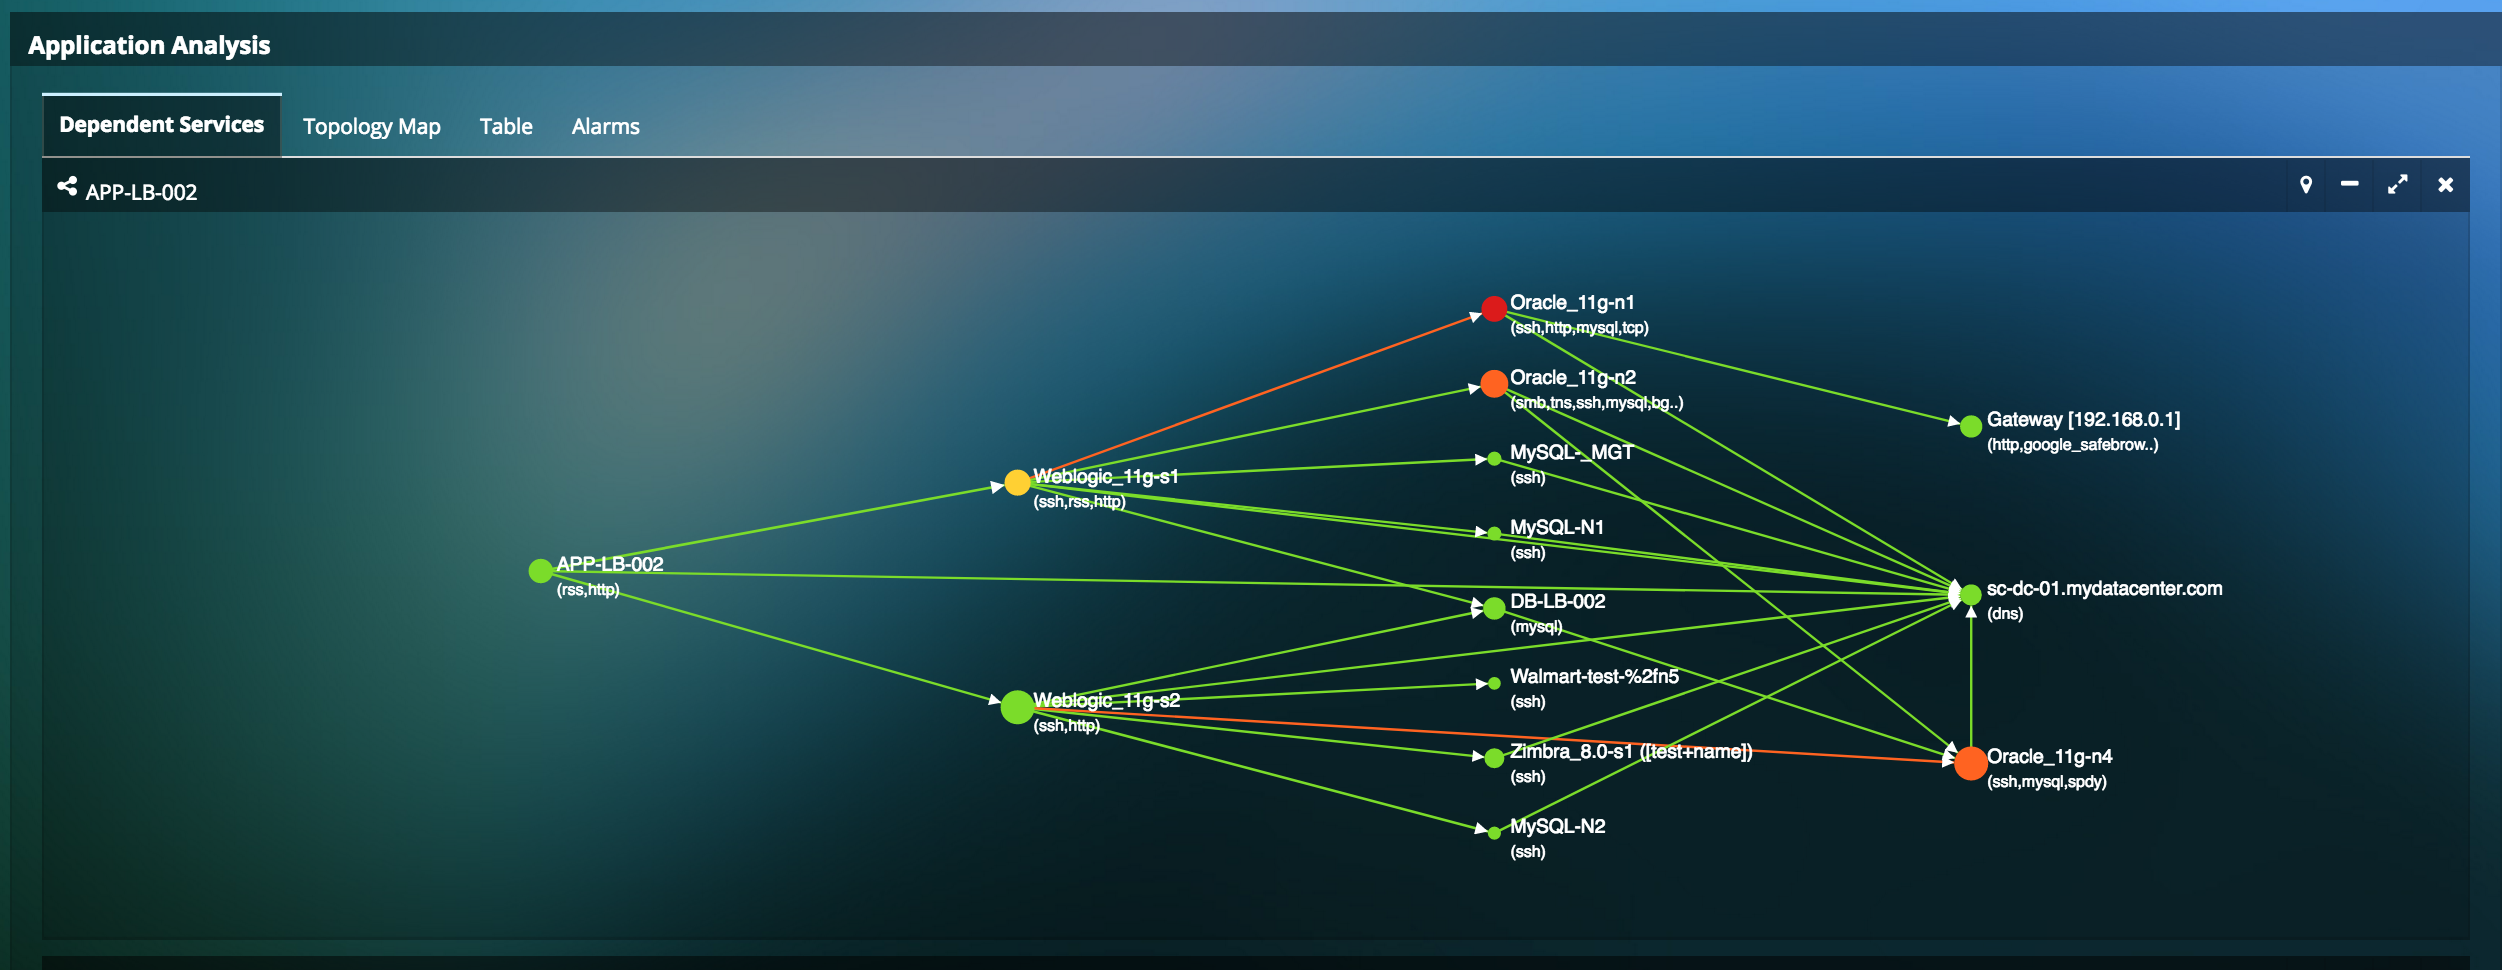
- Automated visualization of all virtual, physical and cloud assets and their interdependencies at the application level without the installation of any agents.
- Direct DPI-based classification for over 3,600 applications (web, database, SaaS, healthcare, financial, etc.).
- Automatically generated and updated in real-time for all applications.
- Create and customize multi-tier application groups based on your requirements.
Migrate to HCI with Confidence
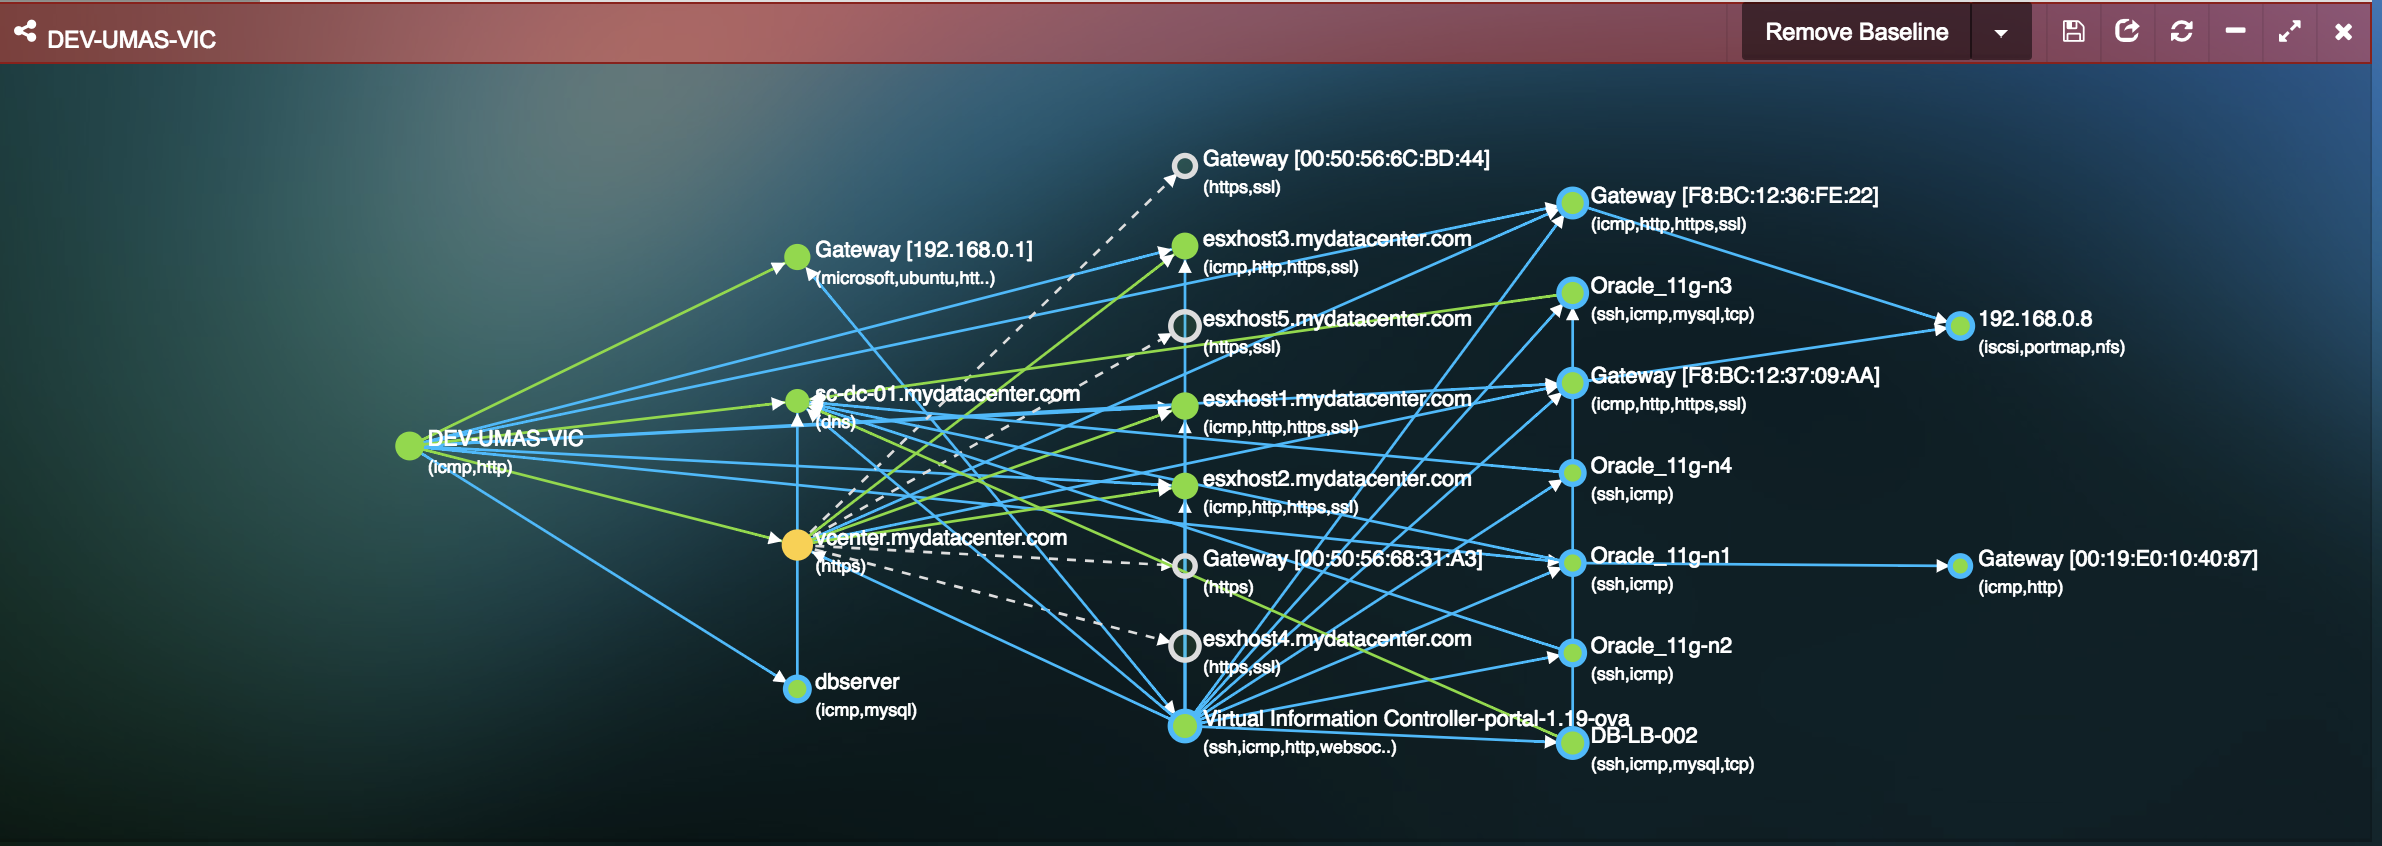
- Plan customer's Workload migration strategy from Non-HCI to HCI environments with deep insights into current application usage and their dependencies.
- Prevent surprises with incomplete migration of applications or infrastructure components.
- Reduce business risks for you as well as your customer with the most accurate pre-migration assessment.
- Intuitive Application services inventory map and current performance baseline to ensure successful migrations for multi-tier applications.
- Visualize Application, Services, Interdependencies and Topology map to understand all dependencies & Identify your Technical Debt before migration.
- Comprehensive Resource Provisioning and Usage, including CPU (cores, Ghz), Memory (Gb) & Storage (Capacity, IOPS, Latencies)
Eliminate pain points within the Compute Resources
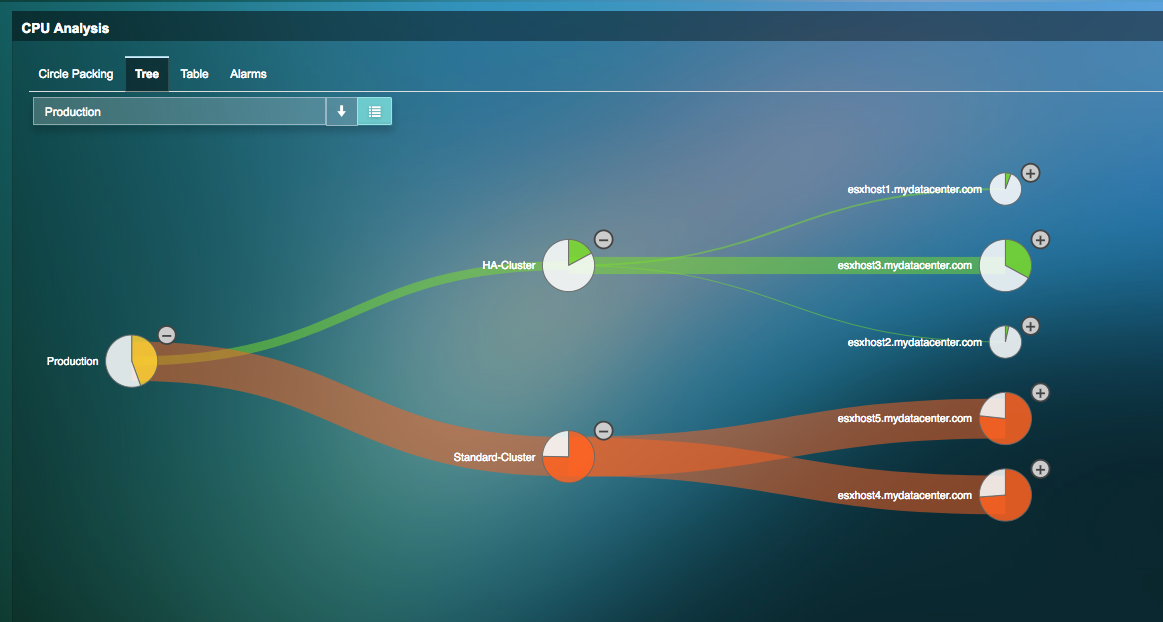
- Visualize how compute performance impacts application performance by measuring metrics such as CPU swap wait, CPU Ready, Utilization and tie this to the Application Response Time.
- Visualize performance of all memory arrays in your hosts with respect to the infrastructure currently running in your data center. Get up-to-date information on memory usage, swap rate, swap wait times, etc.
- Detailed insights into processes using Compute resources.
- Guidance into solving under- and over-provisioned resource challenges.
Real-time Network Performance Monitoring to Proactively Stay Ahead of Issues
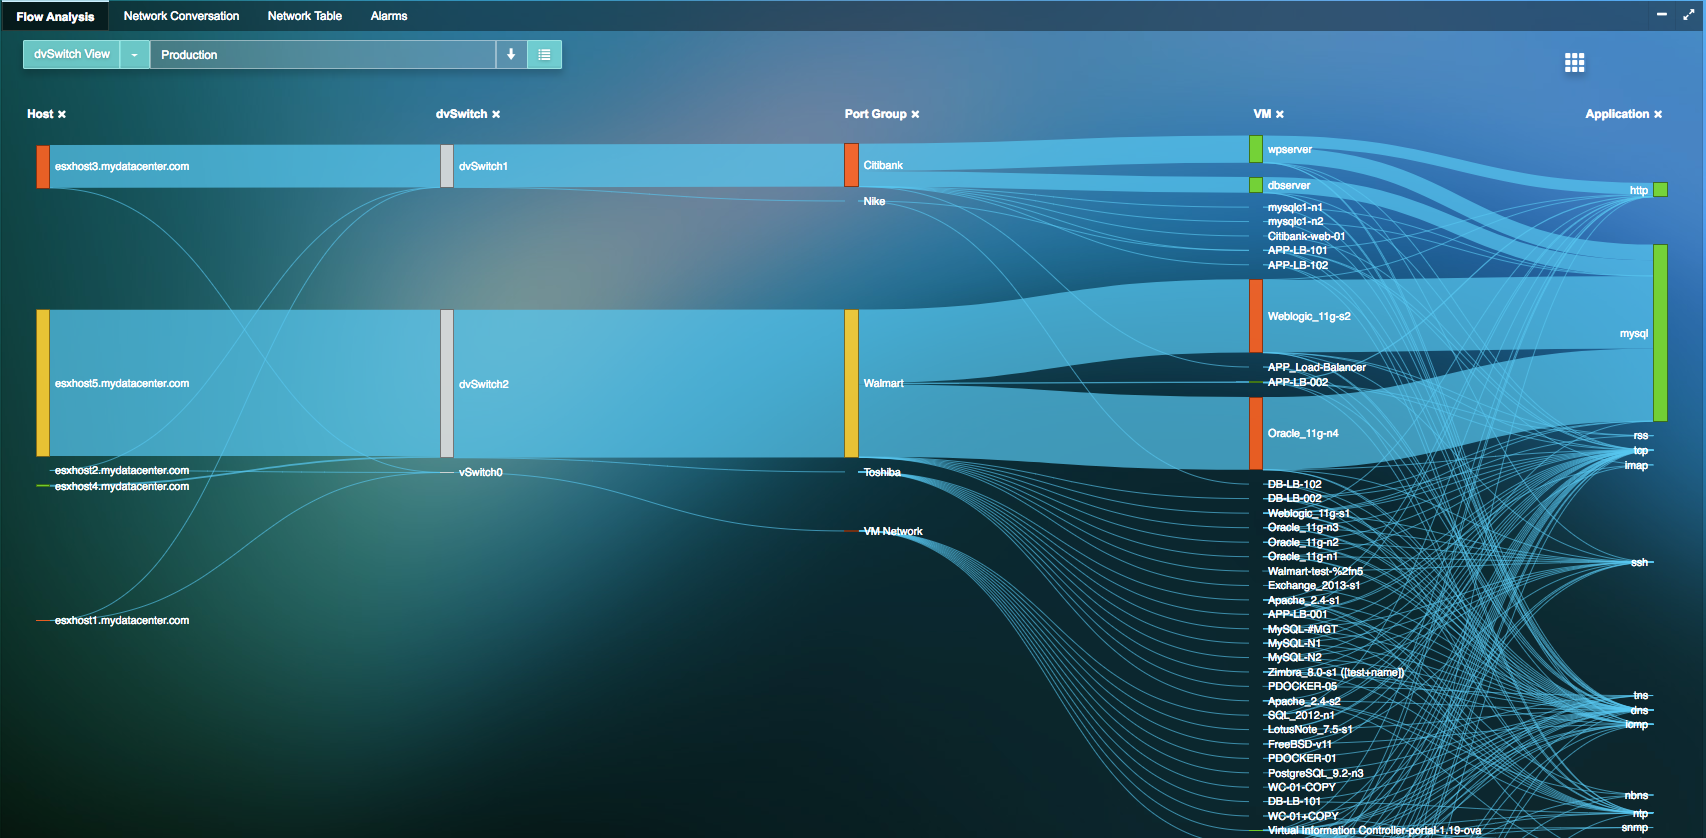
- Visualize how virtual network traffic traverses across physical devices, virtual entities & Application Services, to pinpoint network hot spots impacting application performance.
- Review Network Round Trip Time, Traffic Volume, Retries, Packet Drops, Application Response Time for each application.
- Top-down visualization approach from the Application or Business Service to its correlated Infrastructure and Network root cause for faster root cause resolution.
Clear Bottlenecks and Weaknesses in Storage Performance
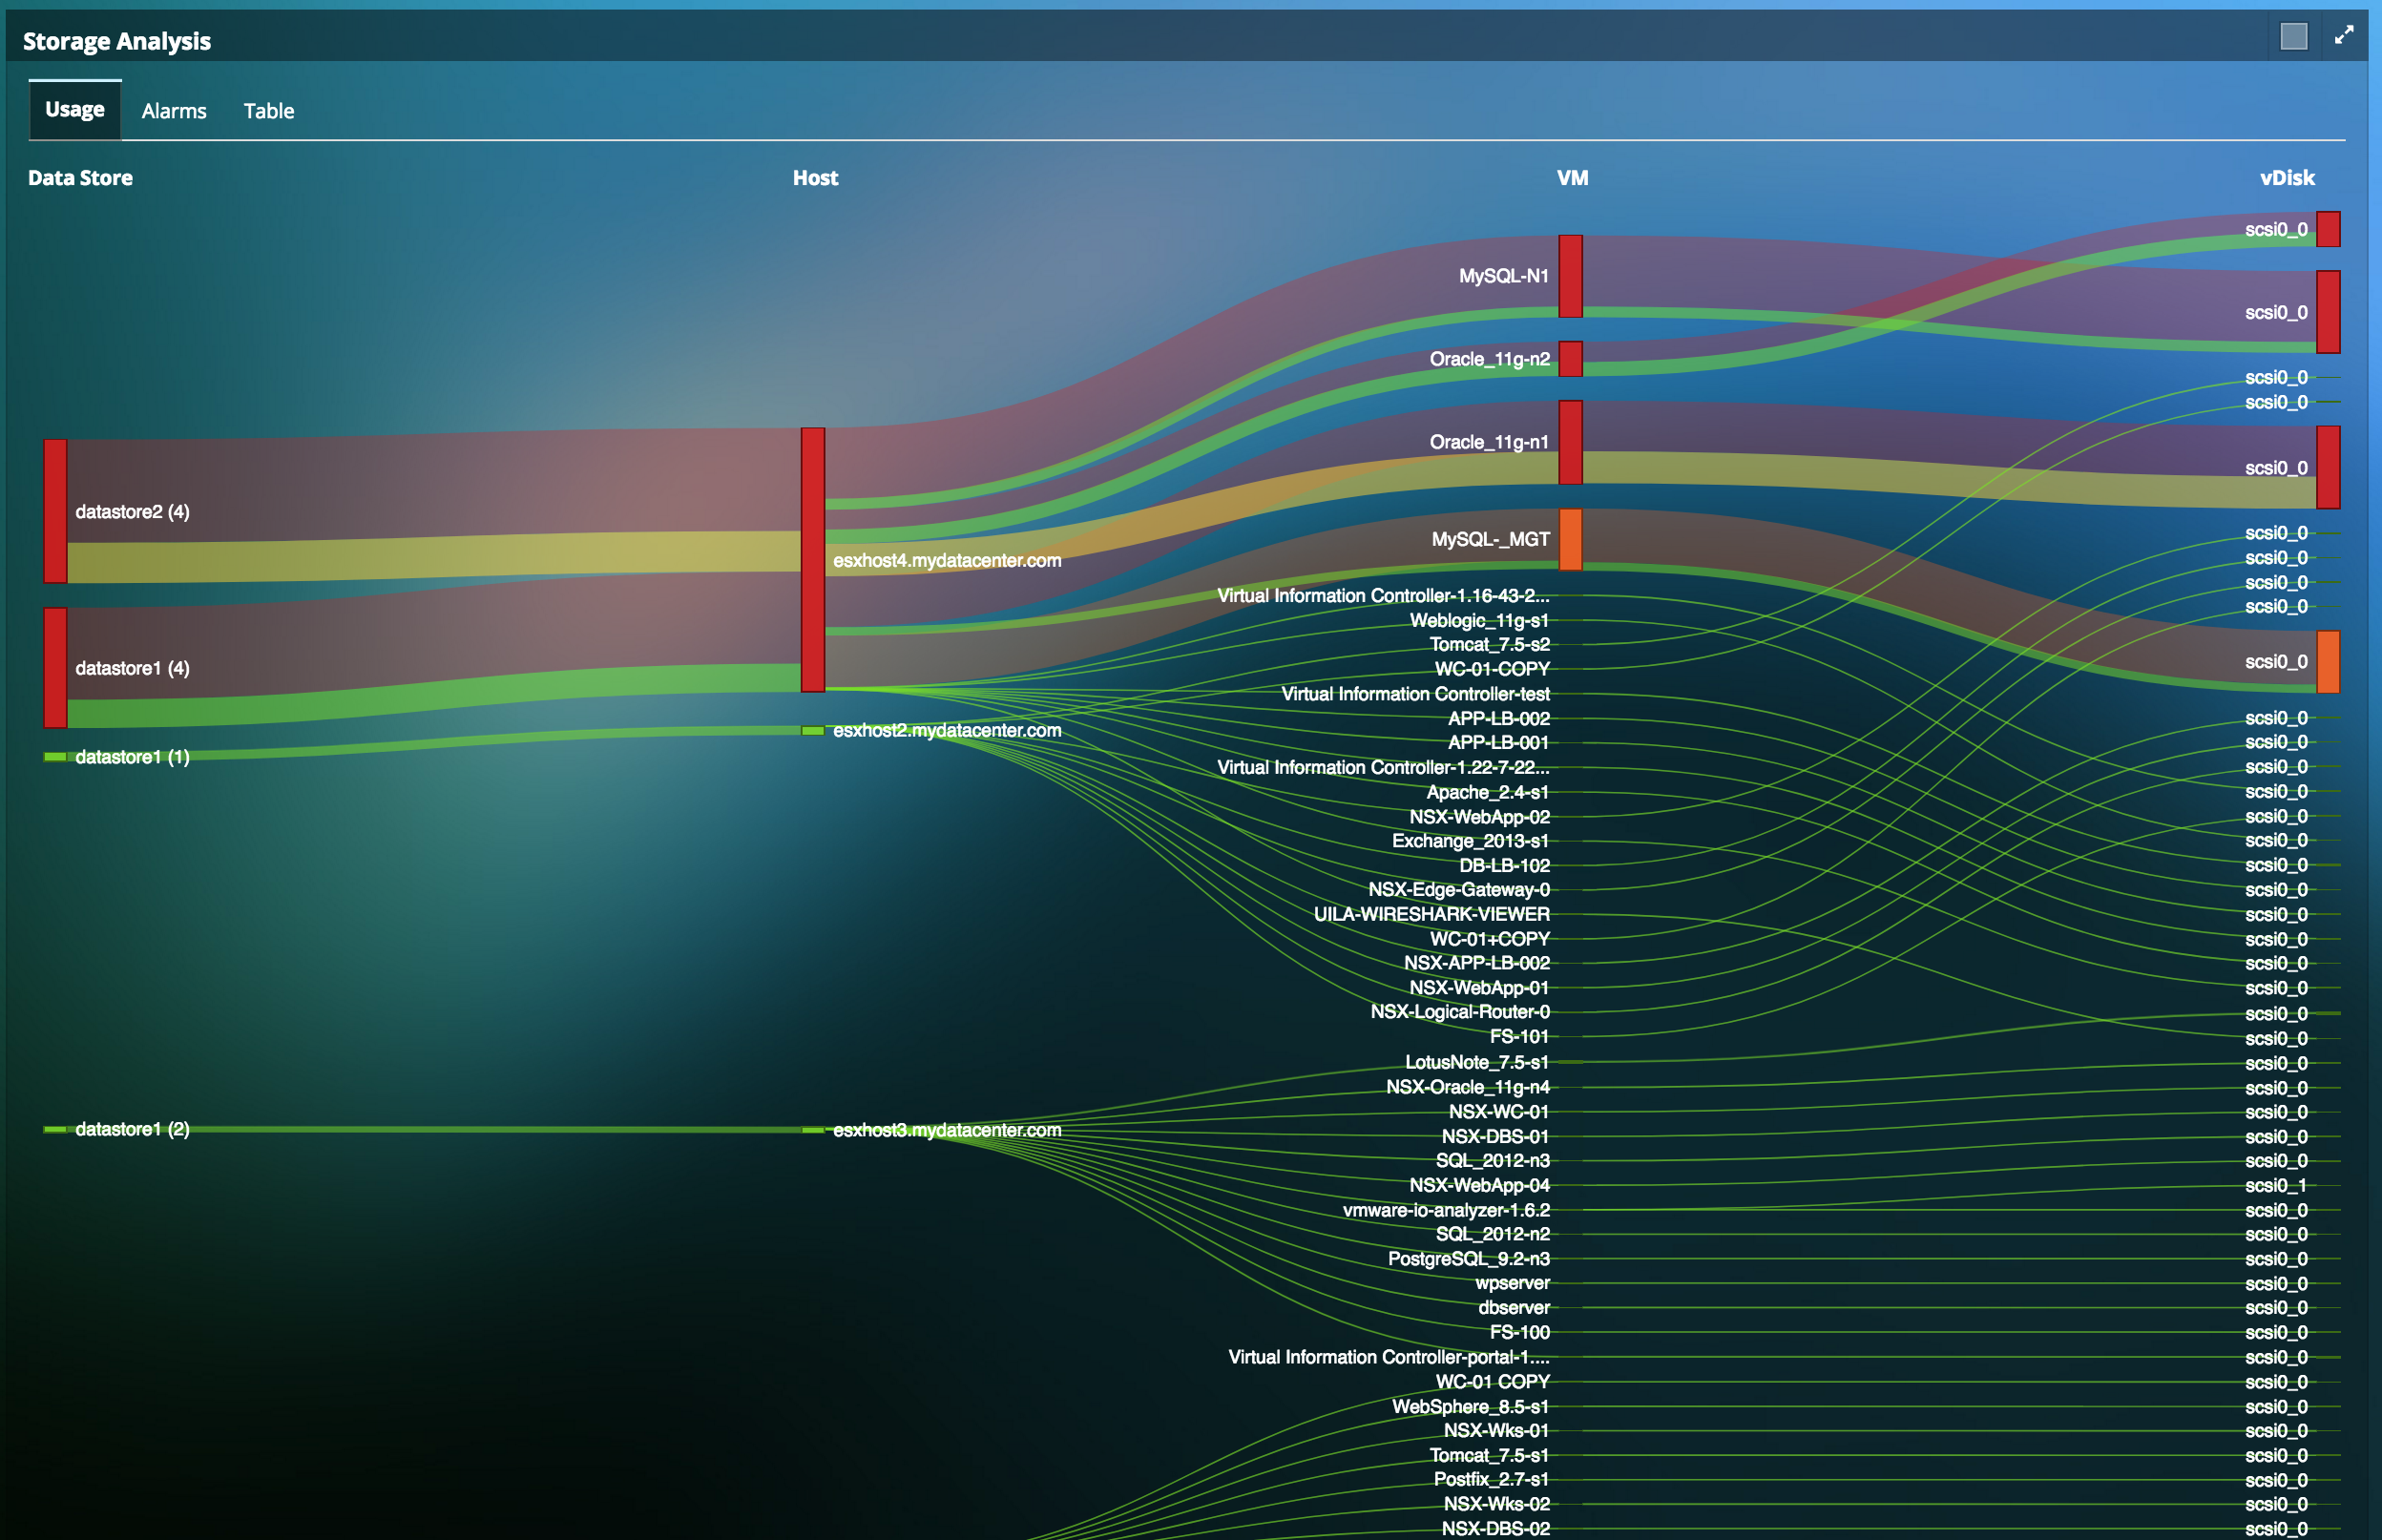
- Monitor Storage performance across multiple vendor’s storage arrays on a 24 x 7 basis.
- Simplify capacity planning procedures with insights into storage hotspots.
- Visualize trending performance issues on Read/Write latencies and IOPS across VMs, vDisk and Data Stores.
- Visualize how the overall storage infrastructure maps to applications, particularly with multi-tier applications.
Resources
-
Uila Monitoring for Nutanix Cloud PlatformBrochure which talks about Uila support for Nutanix Cloud Platform deployments.
-
Lake EMS Success StoryEmergency Medical Services organization instantly solved their Patient Billing System issues in a Nutanix environment.
-
What is Full-Stack Visibility?What is Full Stack Visibility - an interview with Chia-Chee Kuan by ActualTech Media
-
What Should a Full-Stack Monitoring Solution Do?Infographic on what full-stack visibility solutions do and why they are a requirement for every IT organization.
-
Full Stack Monitoring with UilaQuick product video on how to use Uila for Full Stack Monitoring.
Ready to begin your Nutanix & HCI Observability Journey with Uila
Start a 21-day Free Trial Now
Request Trial


