If your home broadband is slow or your cable TV isn’t working, you call the support number. The technician looks at the system status and pings your router, and sometimes gives you the most frustrating answer possible: “It looks like everything is working on this end.”
The same thing happens in IT. When end users call in because an application is slow, they don’t care what your monitoring dashboard says. The application isn’t responding. They’re held up from getting things done, and are thinking about how they’ll have to work late again to catch up. And from an IT perspective, you spend hours in root cause analysis meetings based on issues users reported -- sometimes without really resolving the problem.
We’ve given our customers full-stack visibility into “north-south” and “east-west” performance. With Uila, they can see and quickly correlate issues from the application and database through to the VMs, hosts, network, and storage. But it’s not enough to look at performance from within the datacenter - especially in a virtualized environment, as our CEO noted in a recent blog post.
That’s why our engineering team at Uila spent much of the last few months building end user performance monitoring capability. The Uila dashboard now lets you see performance issues the way the users see them. As one of our customers put it, it lets them get ahead of issues before users report them: “We can even resolve some issues before users notice.”
How it works
The Uila Virtual Smart Tap installs as a small virtual machine on a host and listens to network traffic. It can identify over 4,000 applications, and by correlating data from VMware vCenter with network, storage and application response times, it creates a performance dashboard for the entire stack.
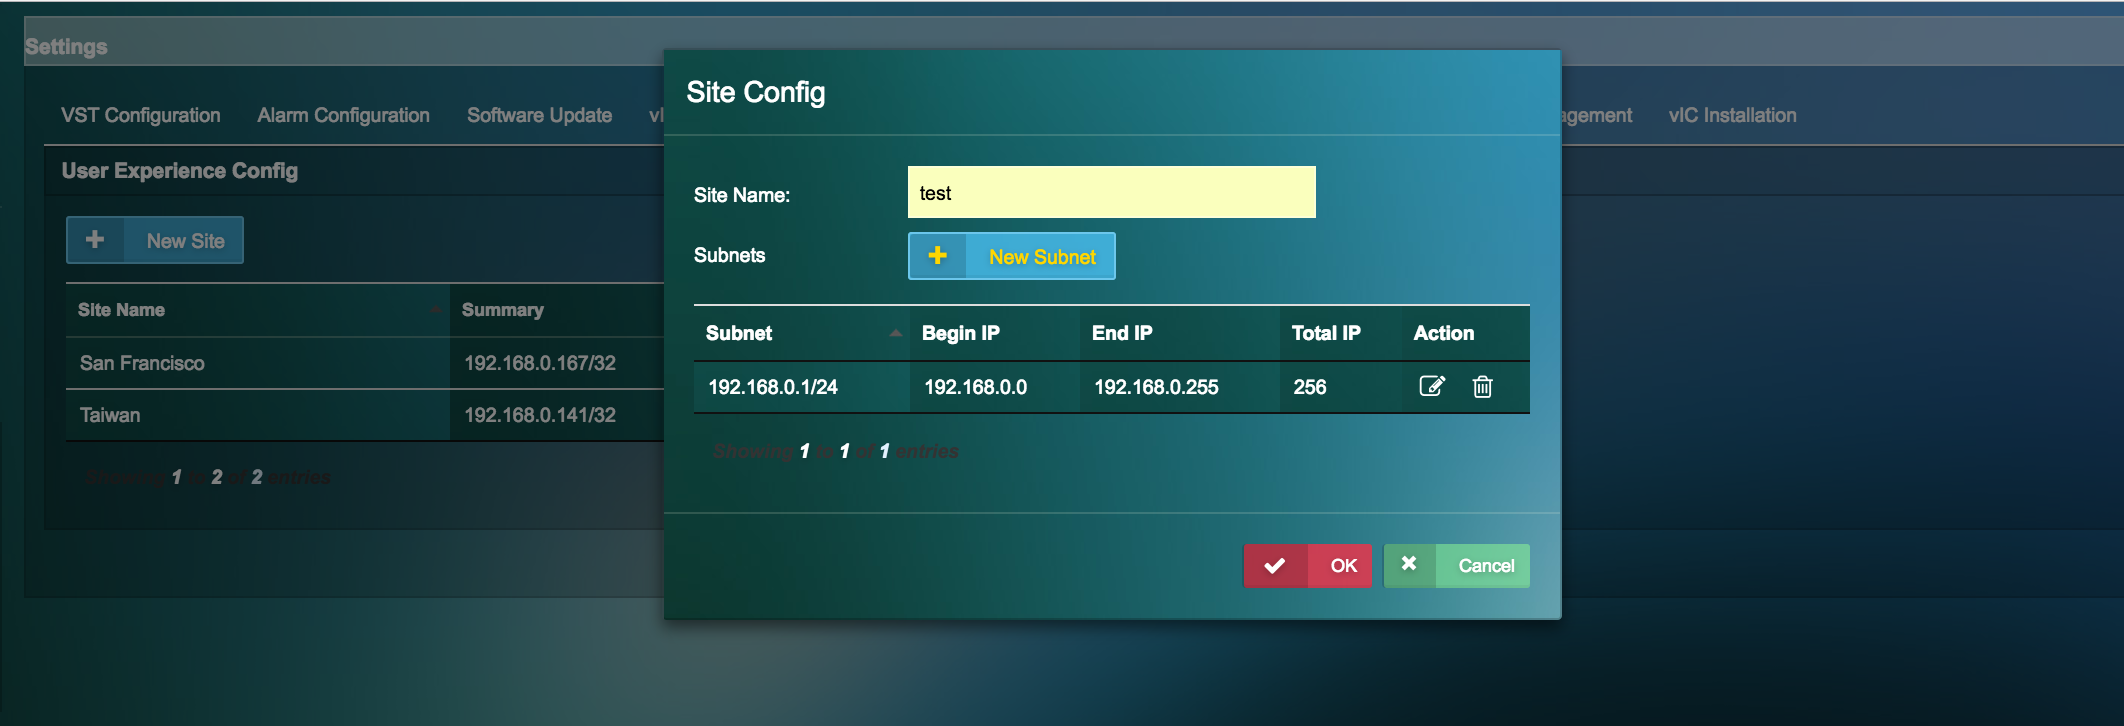
With the end user experience monitoring, we added the ability to define a range of IP addresses as a “site.” These could represent physical offices, but could also be defined for a specific department or set of systems. Importantly, there’s no software to install on client systems -- just the Virtual Smart Tap that’s already running as a VM.
Figure 1: Configuring the IP address range for a site is a simple step.
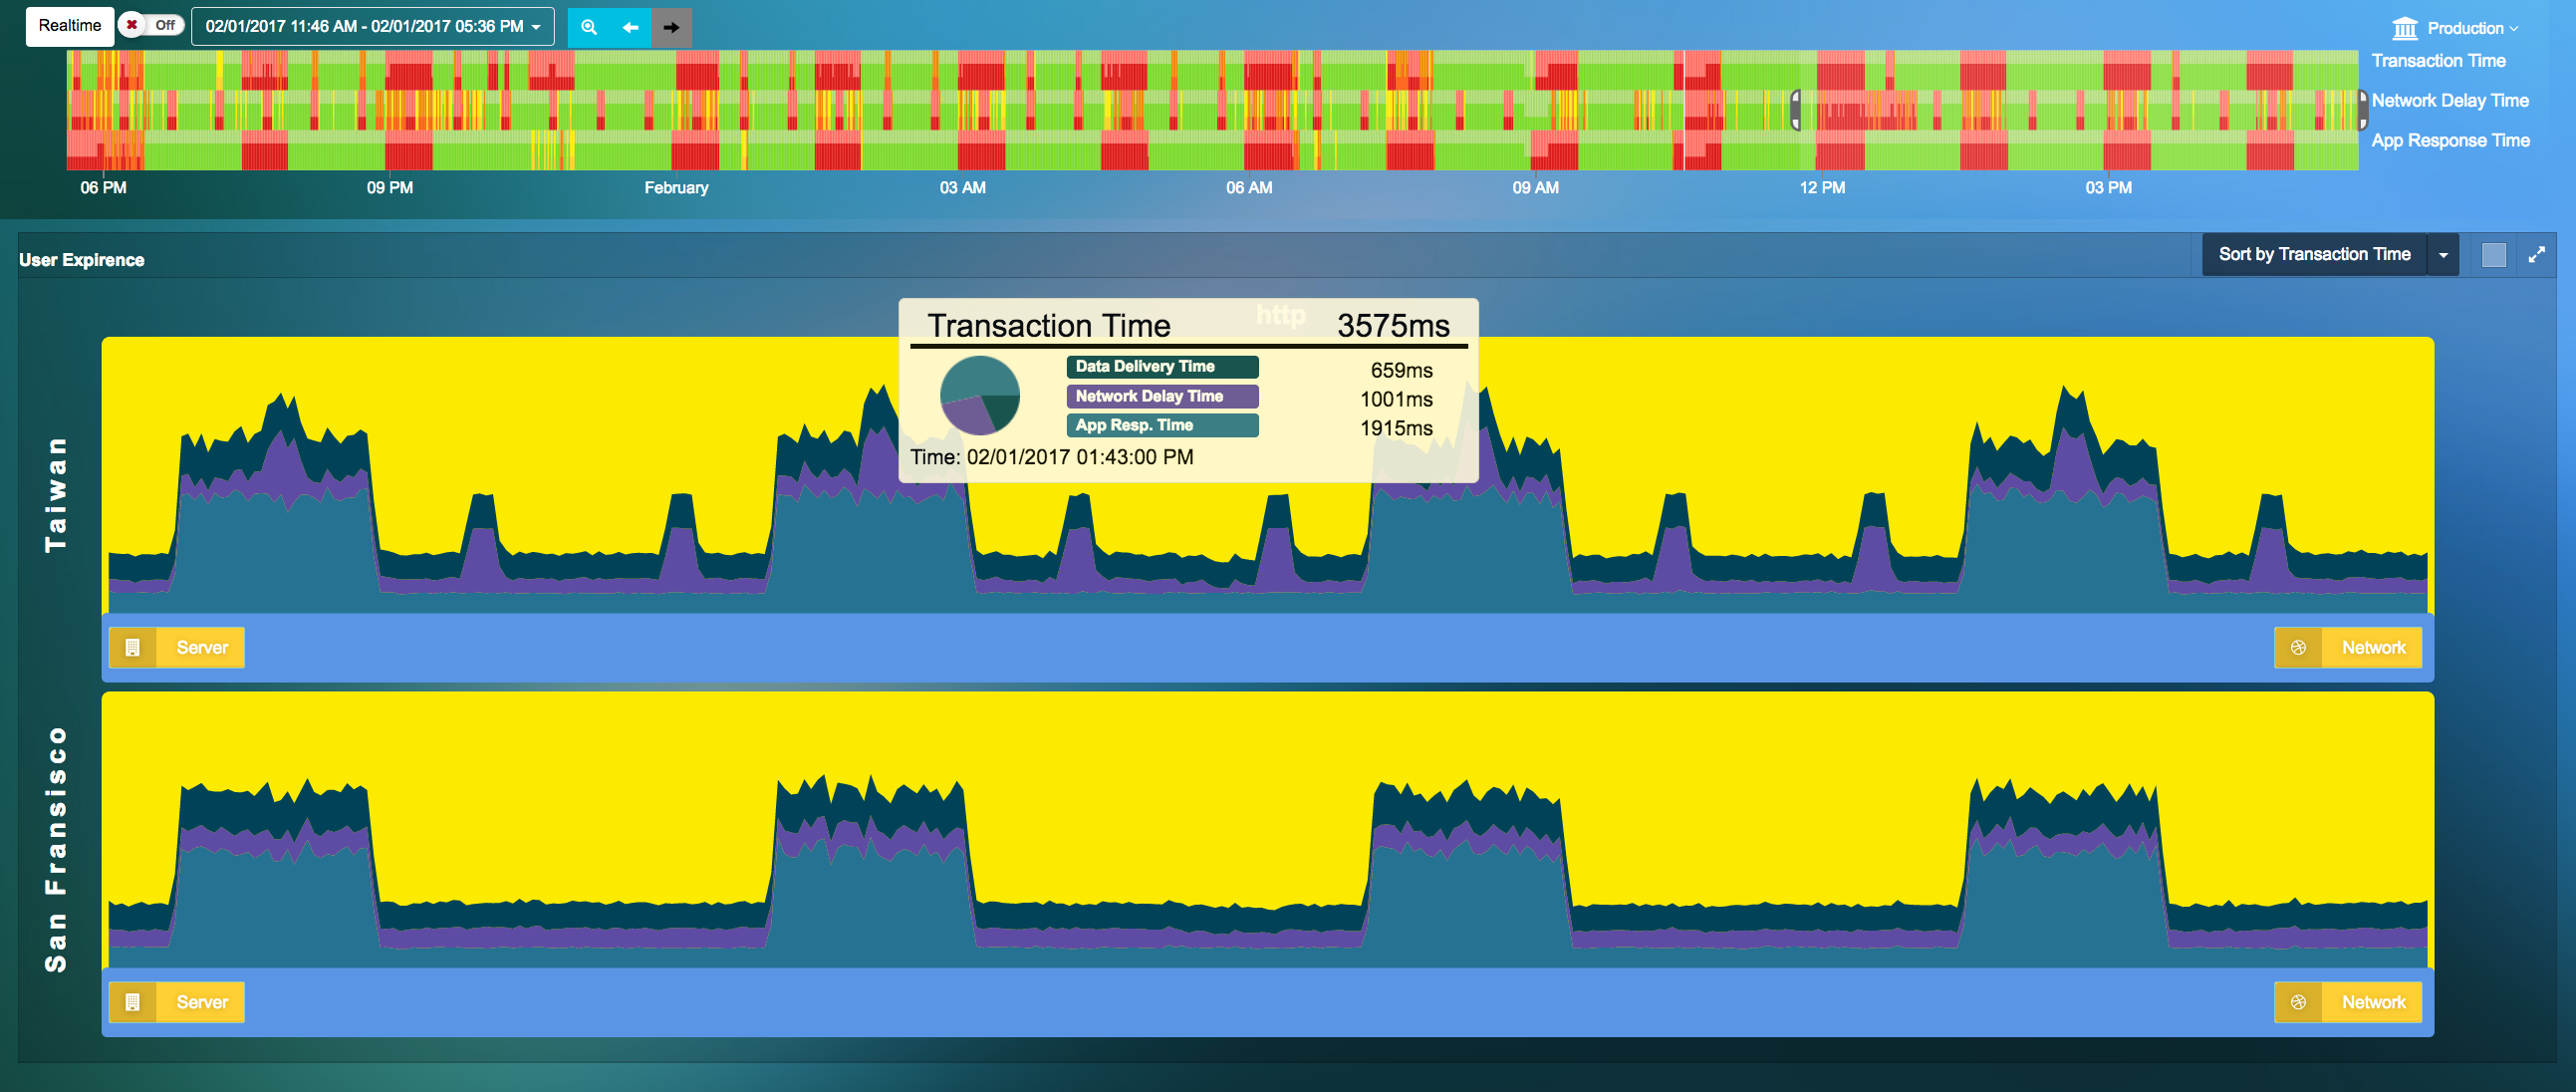
Once you’ve done this, the site is configured and you can view site-specific performance. In the view here, you see two sites, so you can easily compare and identify potential issues that may span sites.
Figure 2: The monitoring dashboard shows overall performance at two sites in this example. If you hover over an area, you get more detailed data.
Even if you configure a site after you suspect a problem, you’ll be able to see historical data since Uila is already monitoring the environment and builds a new view in the dashboard showing the site-specific data.
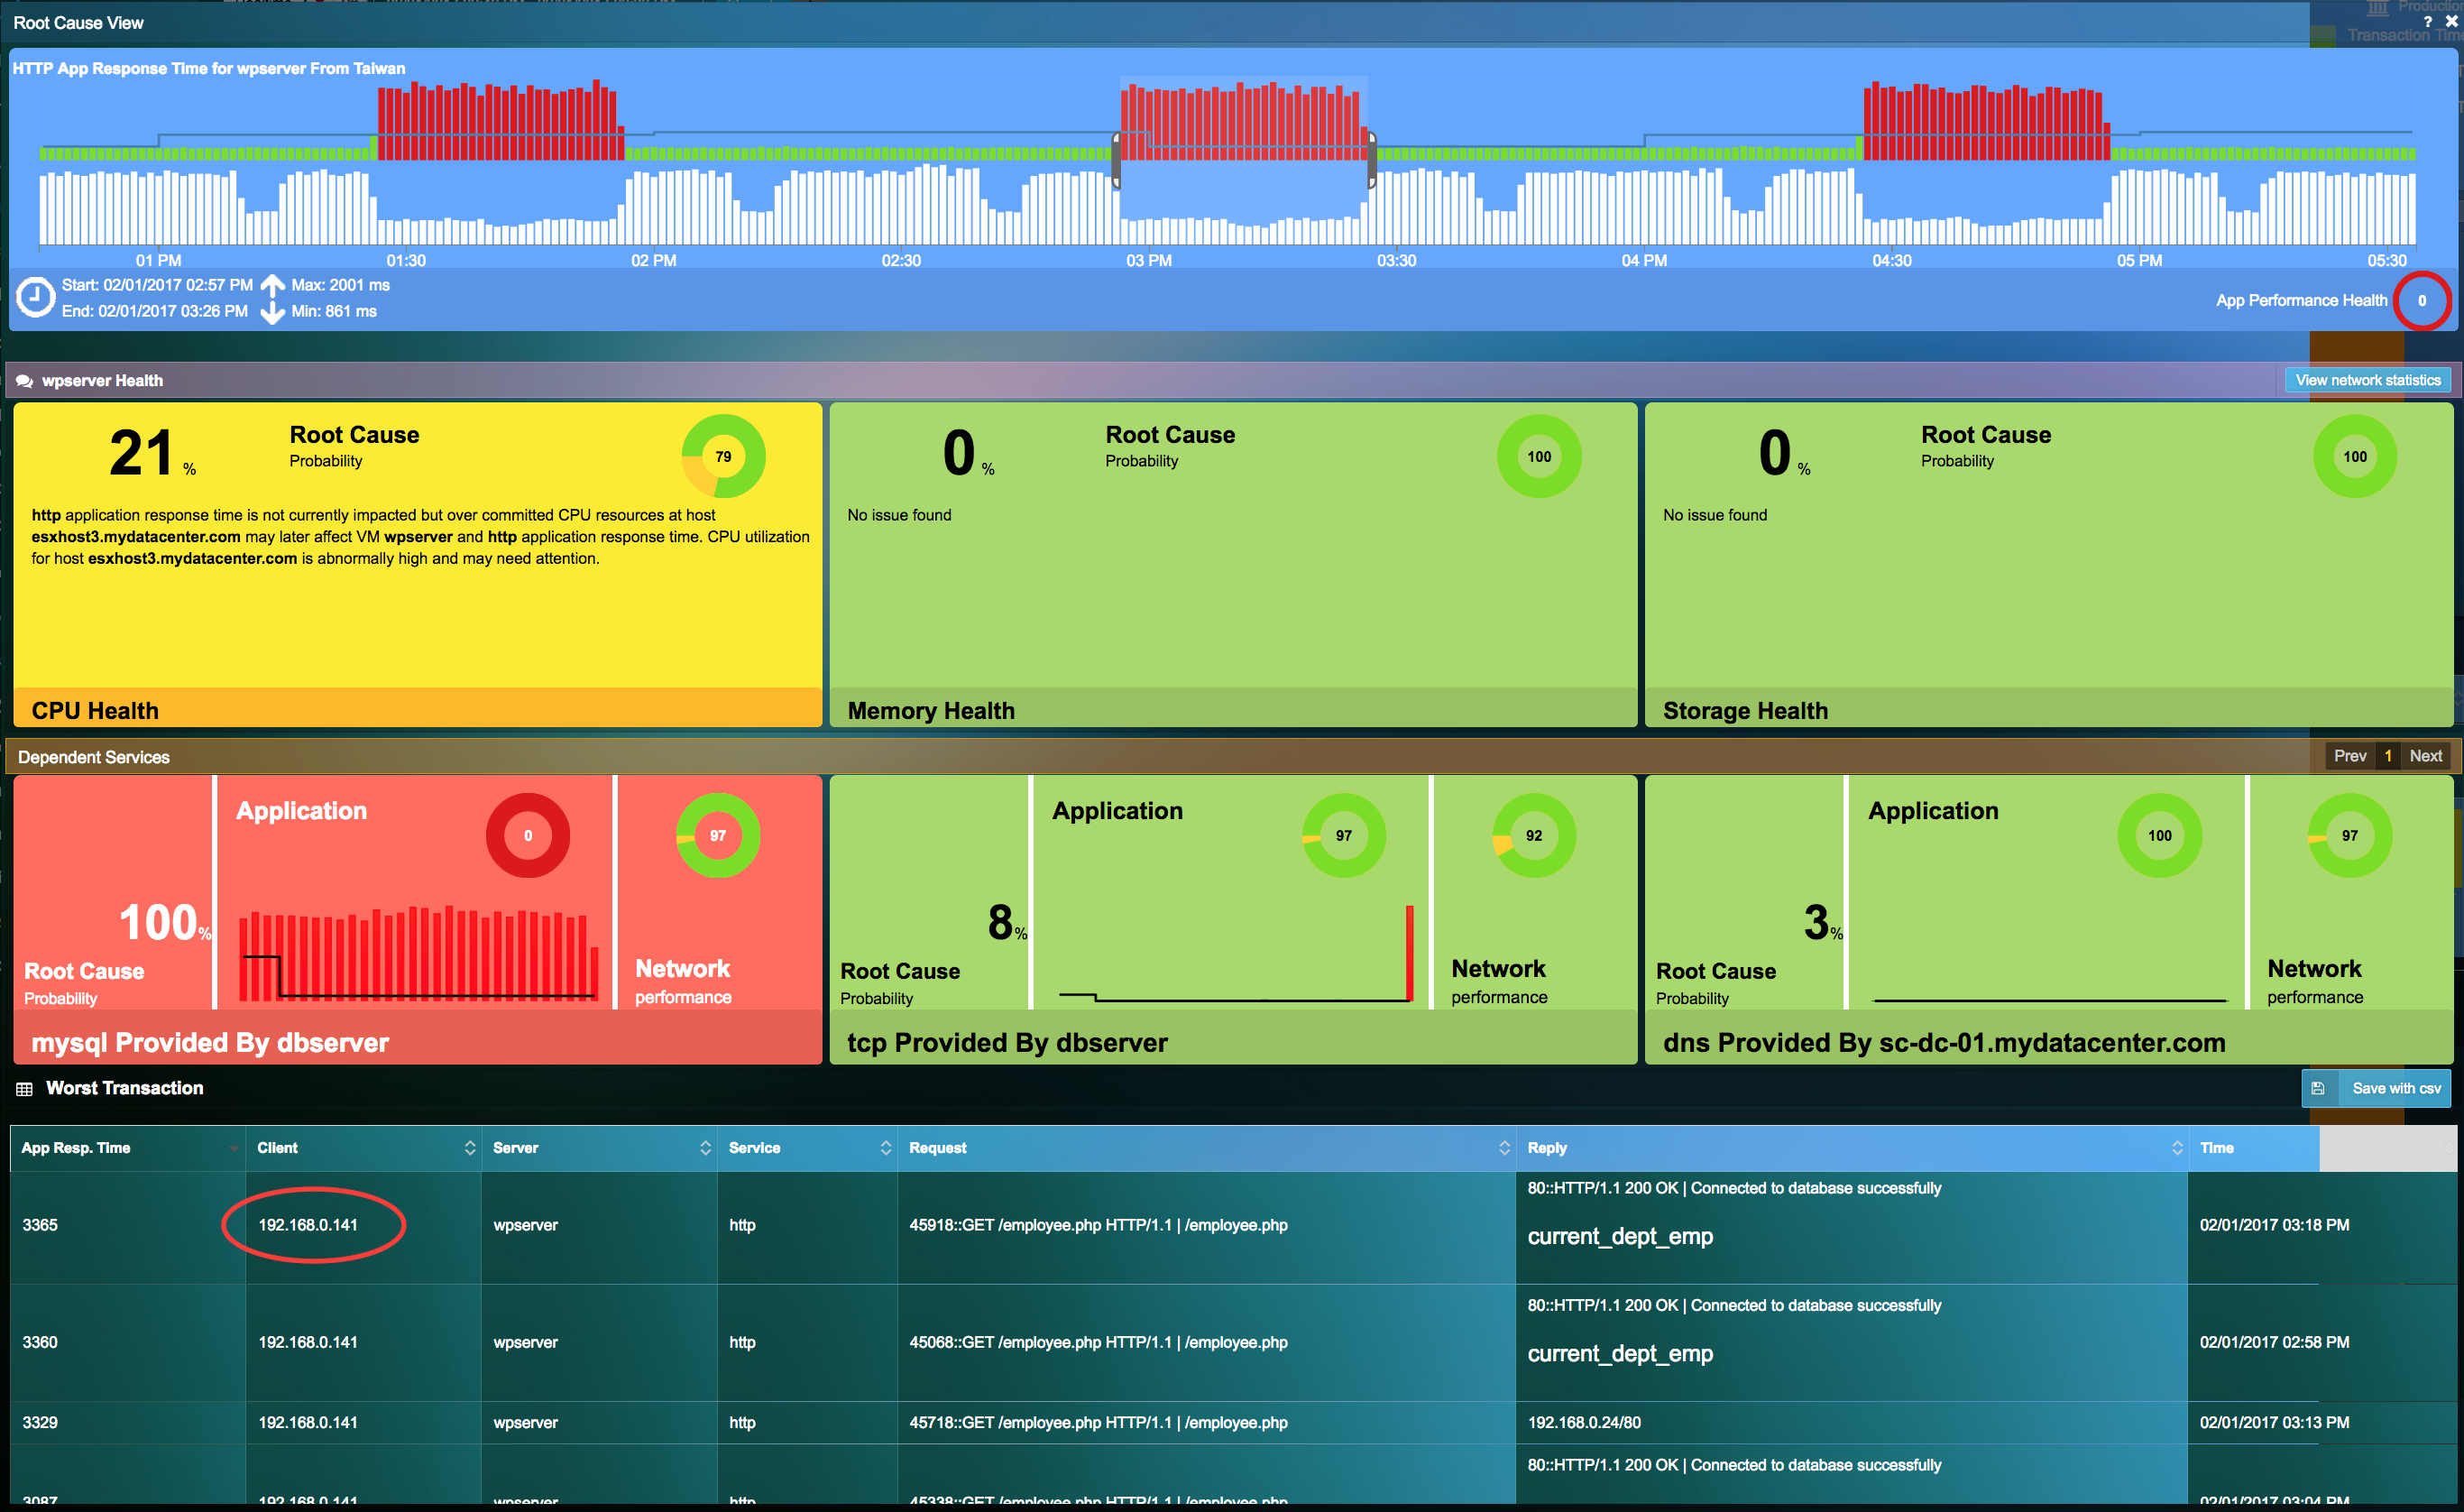
And if you need to really look at performance from a single user’s perspective, you can do that, too. Since every device with an IP address shows up, you can evaluate network and application response times for that user by filtering down to their machine IP address.
Figure 3: Every IP address in the defined range shows up, making it easy to identify the root cause of an issue -- even if only one user is experiencing it.
There’s quite a bit more to this, of course. I did a demo earlier this month at the Tech Field Day event in Austin. If you’re interested in learning more, you can see the demo here - or reach out to me directly: roger.yao@uila.com.
I hope you do!
Subscribe
Latest Posts
- How Data Center System Administrators Are Evolving in today's world
- Microsoft NTLM: Tips for Discontinuation
- Understanding the Importance of Deep Packet Inspection in Application Dependency Mapping
- Polyfill.io supply chain attack: Detection & Protection
- Importance of Remote End-User Experience Monitoring
- Application and Infrastructure Challenges for Utility Companies
- Troubleshooting Exchange Server Issues in Data Centers
- Importance of Application Dependency Mapping for IT Asset Inventory Control
- Navigating the Flow: Understanding East-West Network Traffic
- The imperative of full-stack observability


