Prove its NOT the Network with real End-user measurements
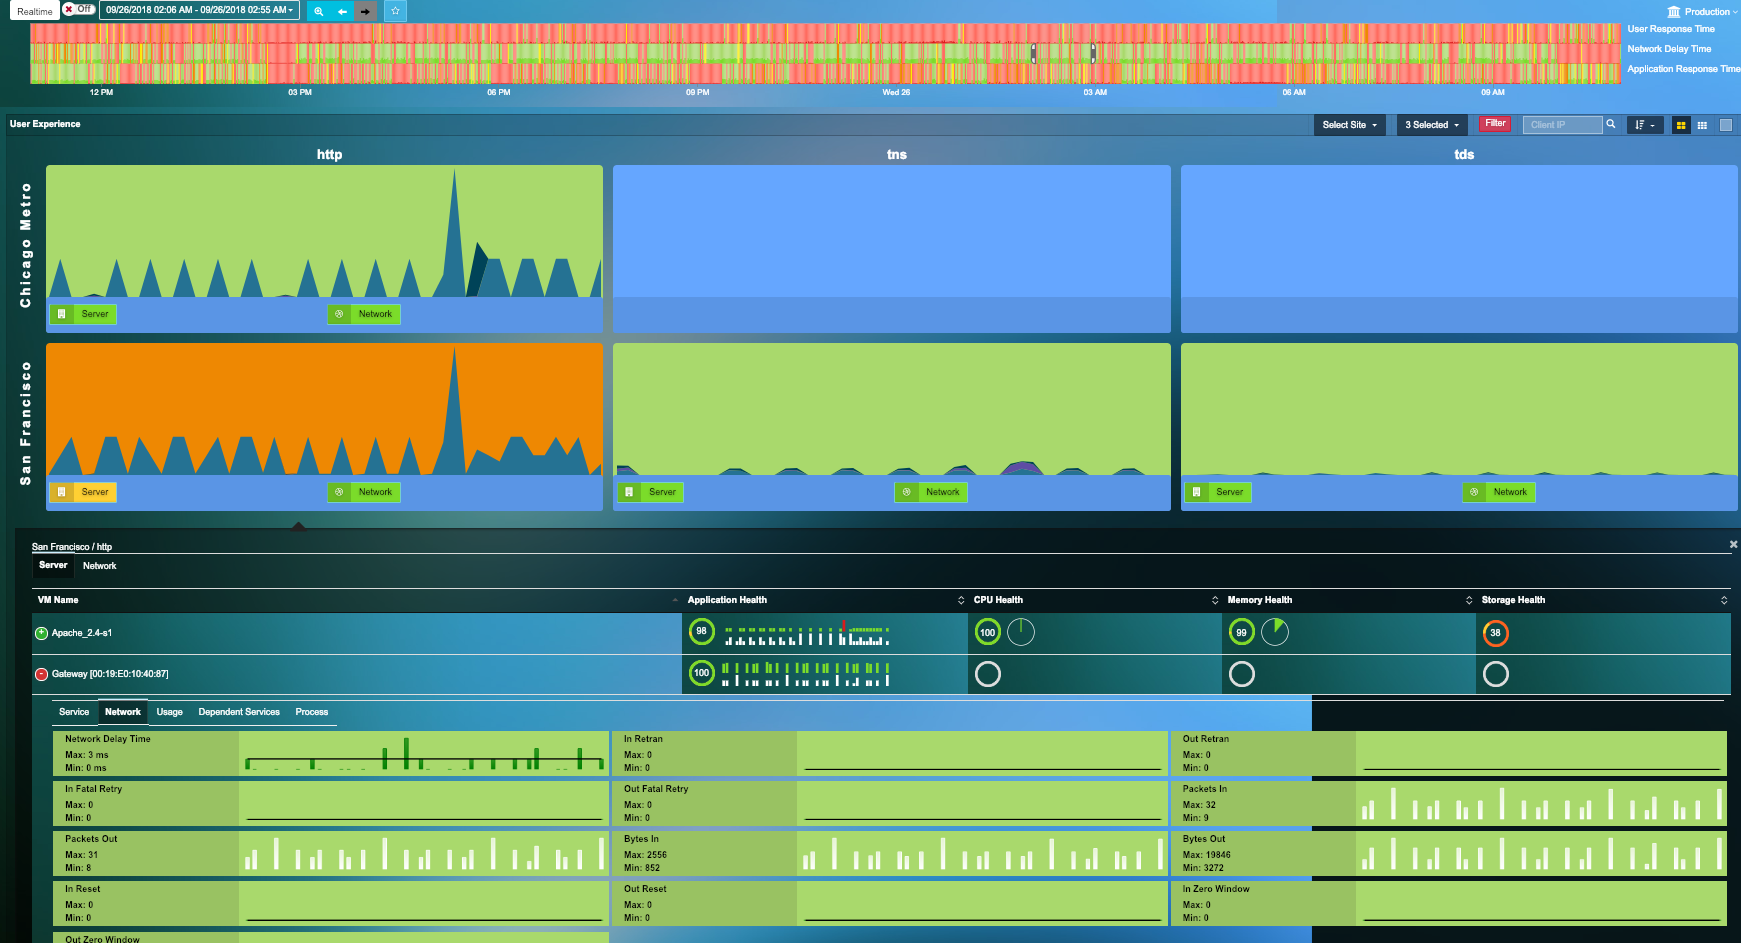
- End user response time tracking proactively alerts IT to service degradation from the user's perspective before user and revenue impact. Easily pinpoint that the Network is NOT the root cause.
- Response time analysis breaks down delays by the server, network, storage, application and clients.
- Site-by-site and client-by-client analysis isolates and correlates user issues to the real root cause, thus speeding up troubleshooting time.
Application-Centric Network Device Monitoring
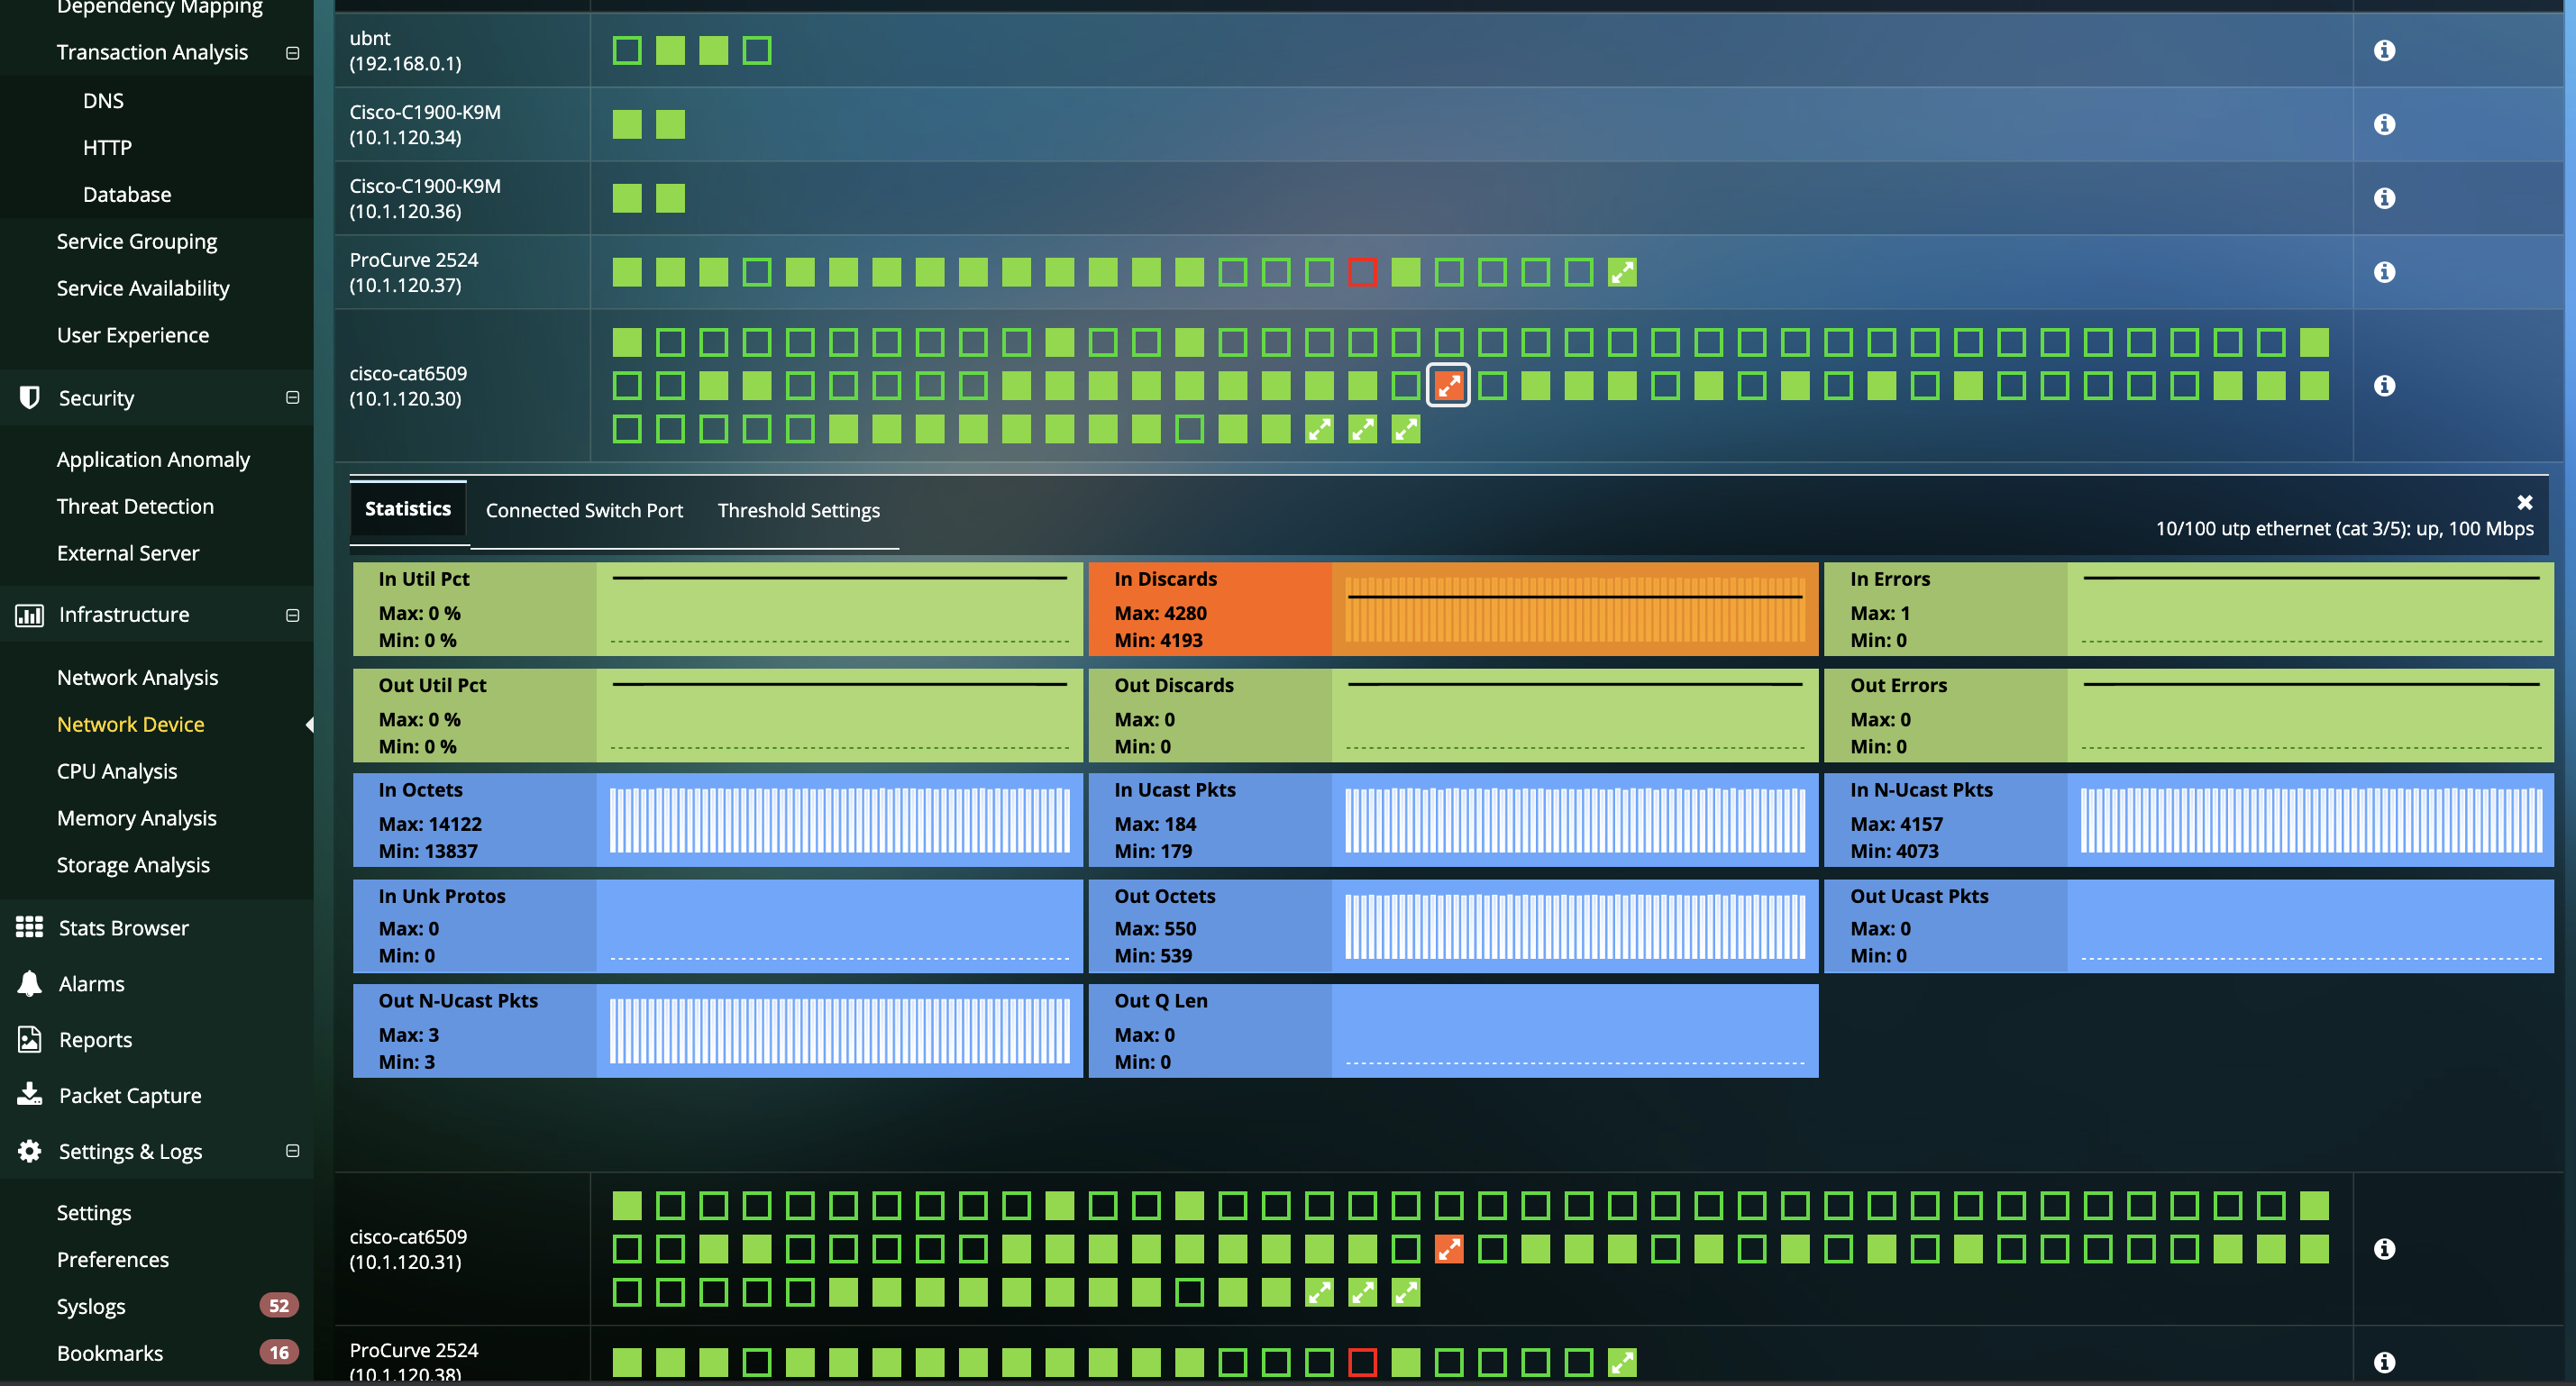
- Diagnose and Resolve Network Device outages and performance issues that are impacting application performance. Prove its NOT the network. Pin-point root cause for application issues due to network devices right from the Application Dependency Map.
- Monitor network device health, availability and bandwidth usage, as well as various other network parameters for traffic statistics including errors, discards, etc.
- Visualize connected VMs to every single switch port and its Application, CPU, Memory and Storage Health to pinpoint performance challenges due to the network device bottleneck.
- Detailed status and configuration settings for network devices including vendor, model, OS versions, uptime, serial number, VTP domain, detailed description, IP/MAC address, etc.
Click here for more details on Uila's Network Device Monitoring capabilities.
Network Device Monitoring
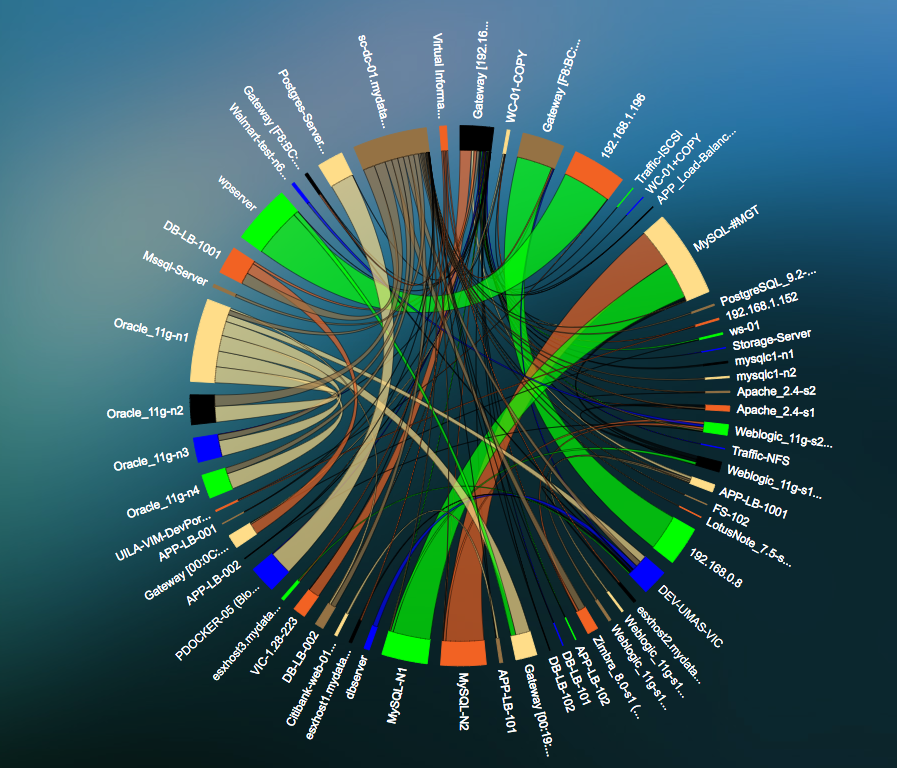
Virtual Network Flow Analysis
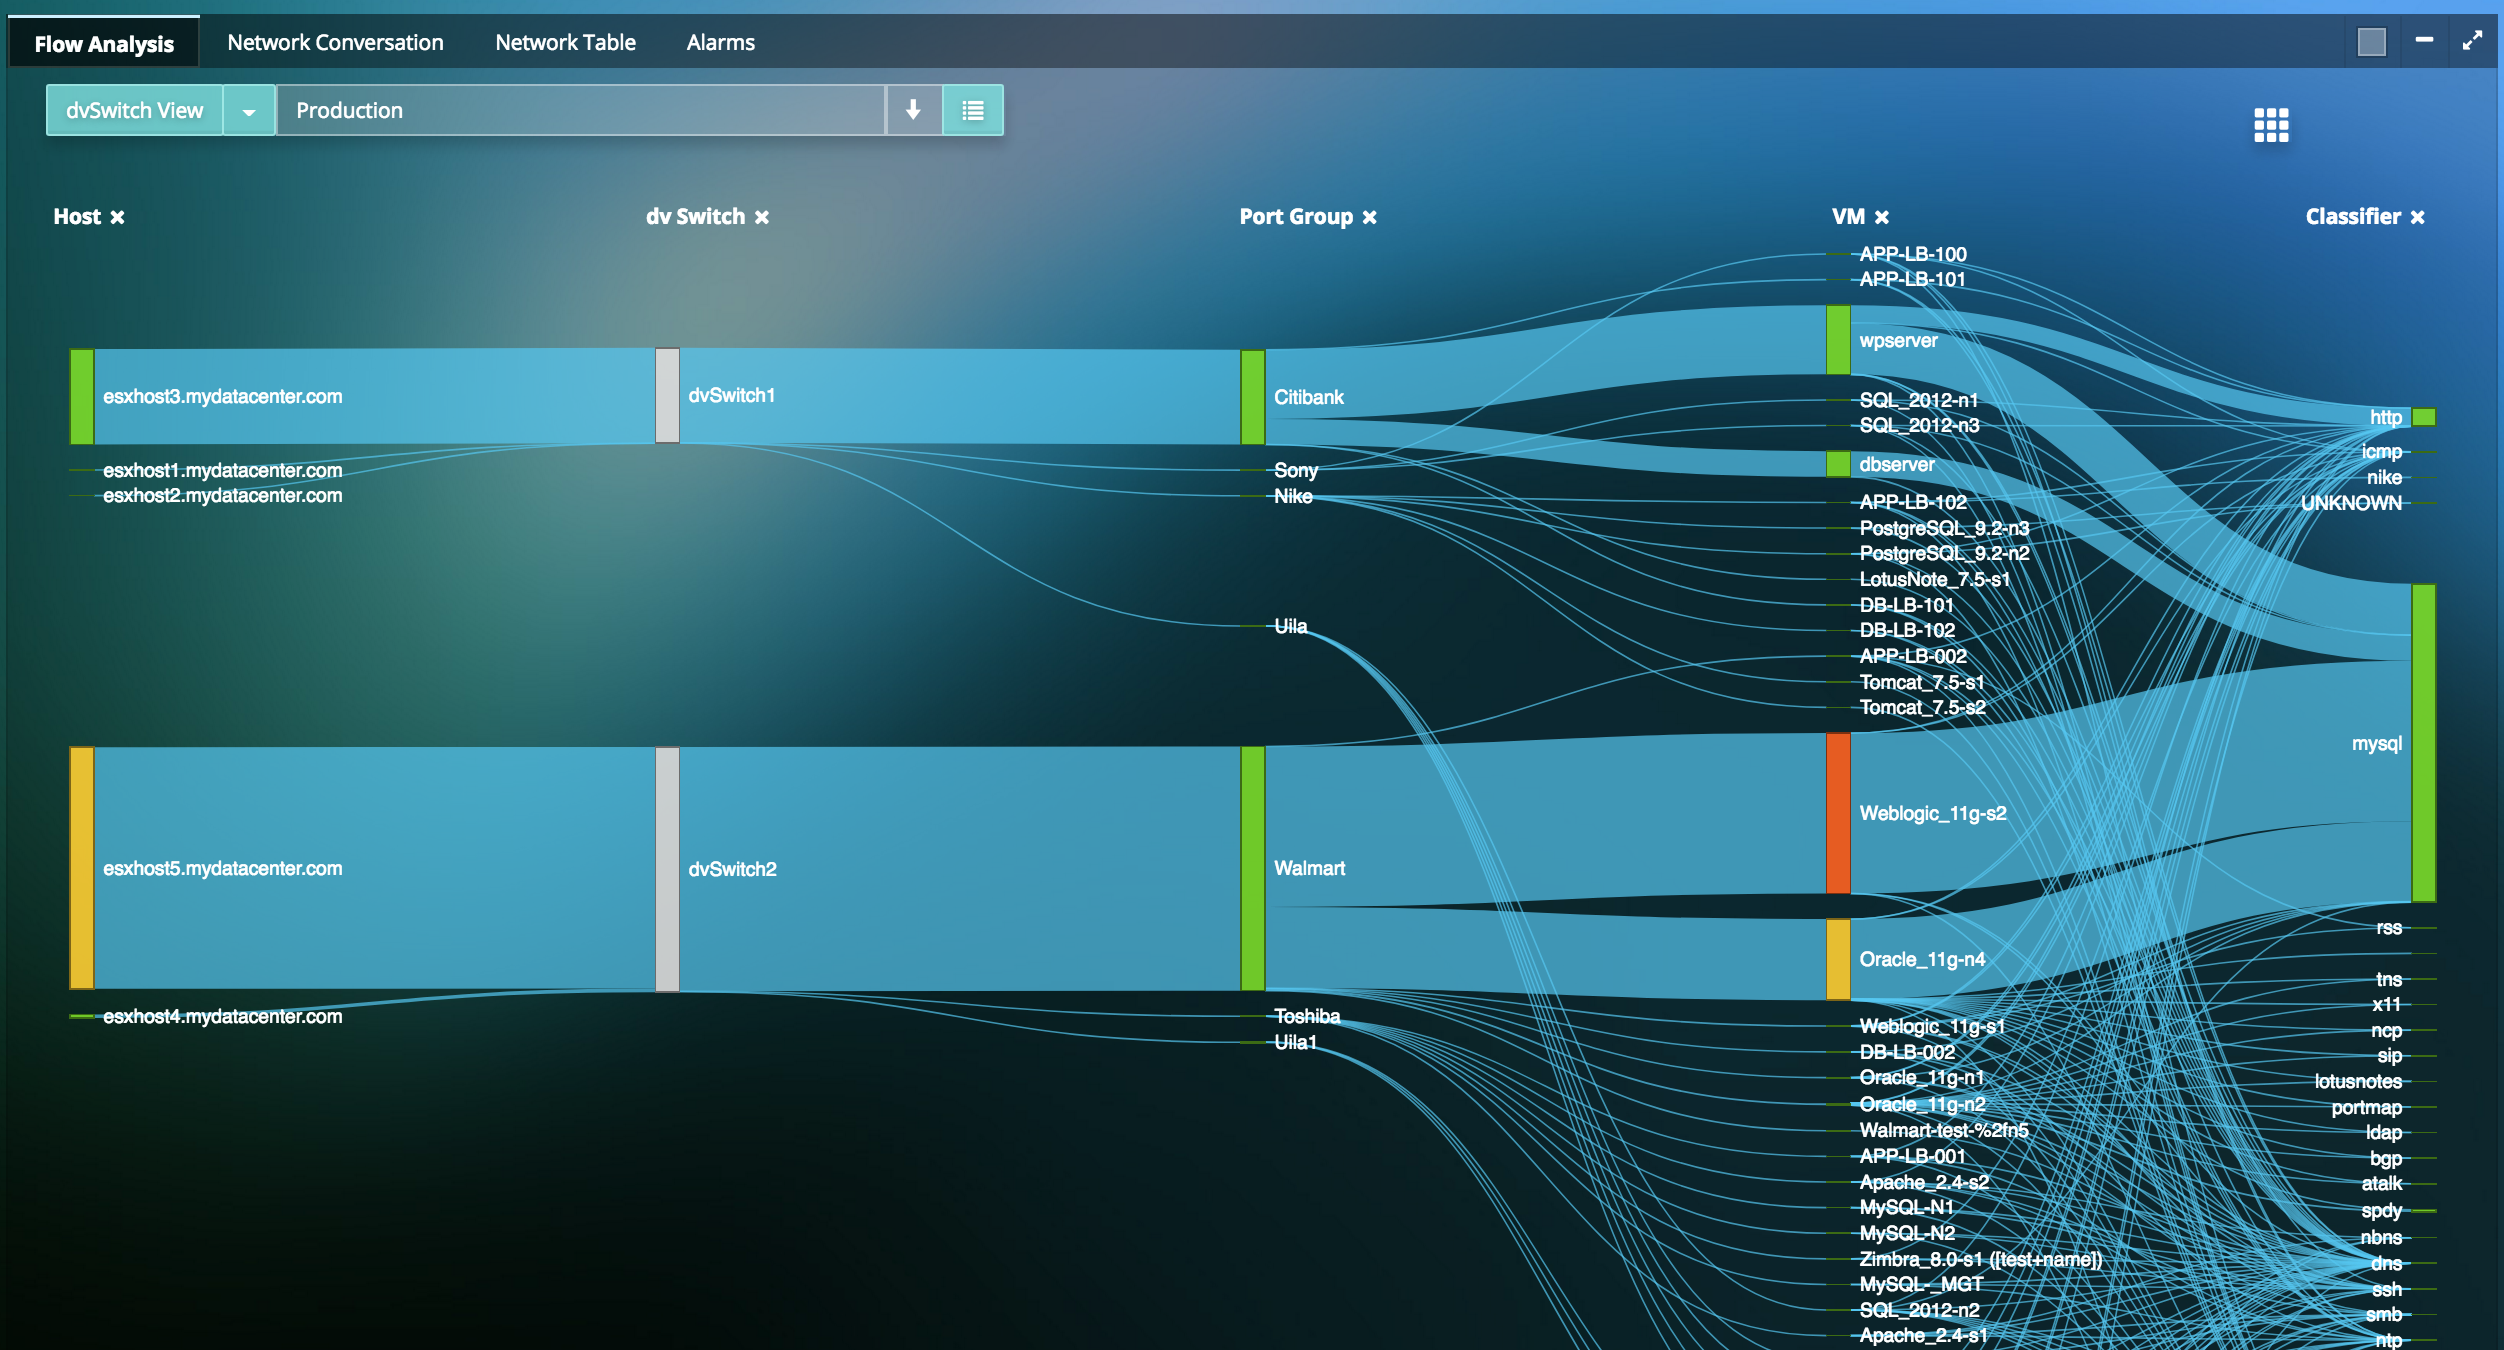
- Visualize how network traffic traverses across physical devices, virtual entities & Application Services, to pinpoint network hot spots impacting application performance.
- Review Network Round Trip Time, Traffic Volume, Retries, Packet Drops, Application Response Time for each application.
- Top-down visualization approach from the Application or Business Service to its correlated Infrastructure and Network root cause for faster root cause resolution.
East-West Traffic & Network Topology Insight
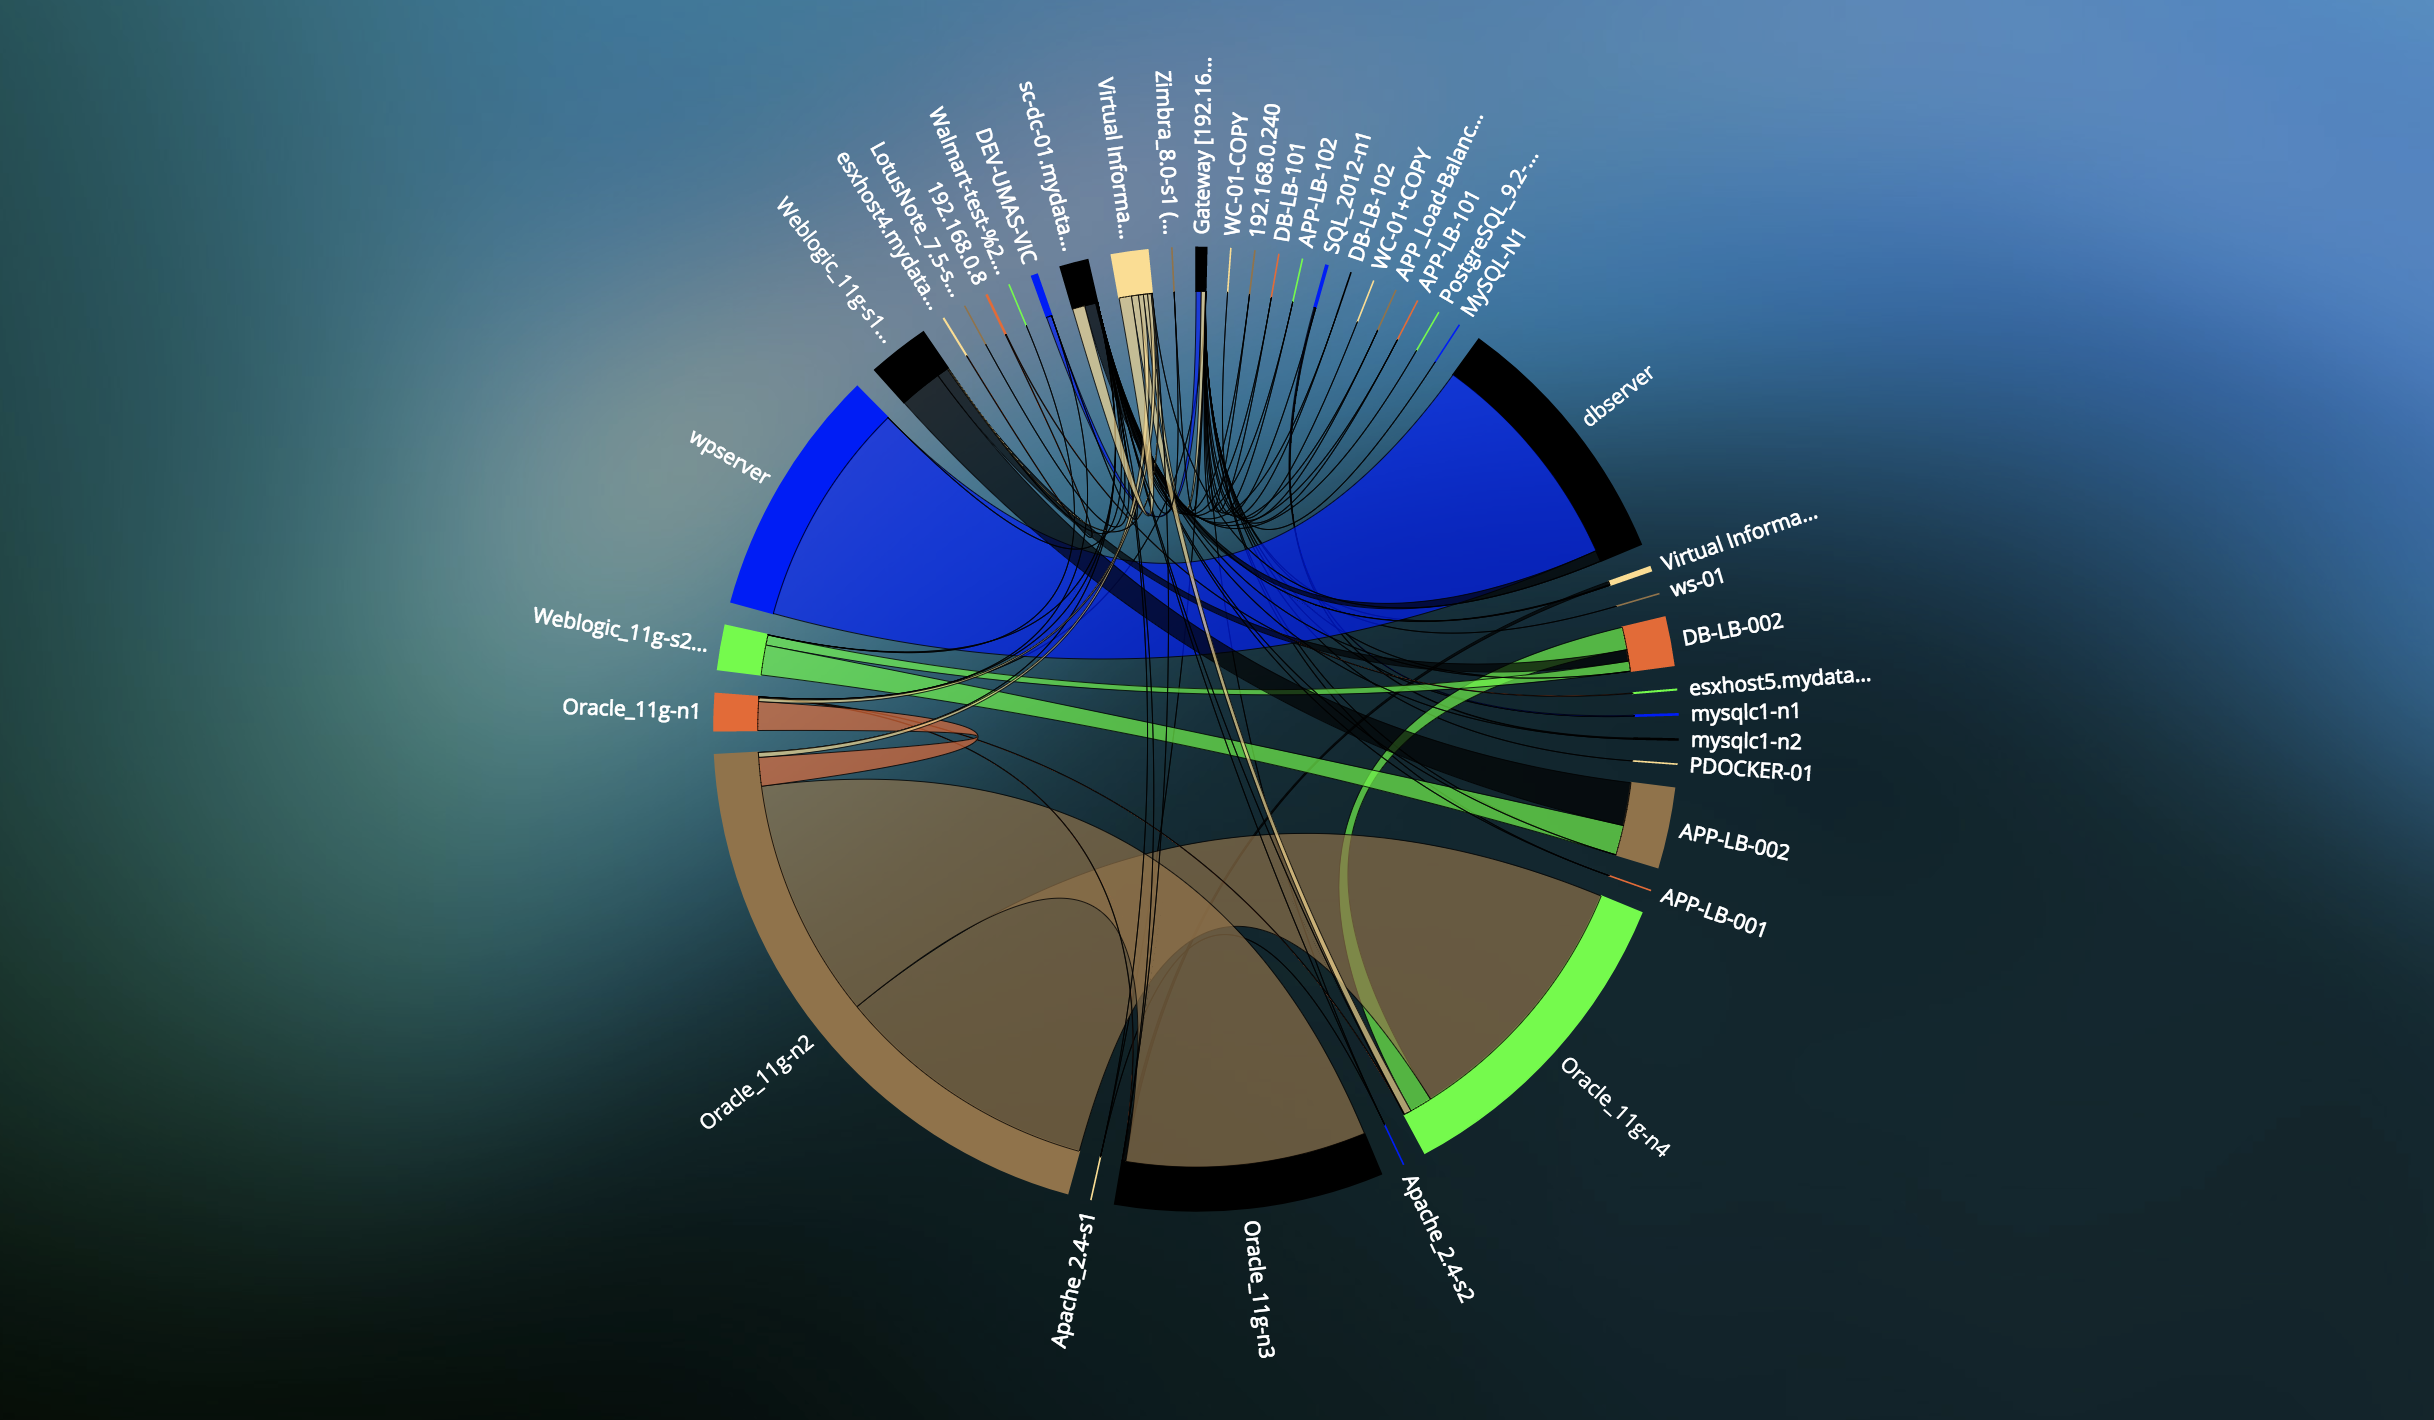
- Visual correlation of network data across entire infrastructure with quick drill downs into status and performance.
- Visualize the top highest network traffic volume East-West VM pairs that may impact performance of others.
- Instant recognition of new devices or connections for comprehensive and up-to-date view of your network infrastructure.
Visualize Interdependencies to build your Microsegmentation plan for VMware NSX and other vendors
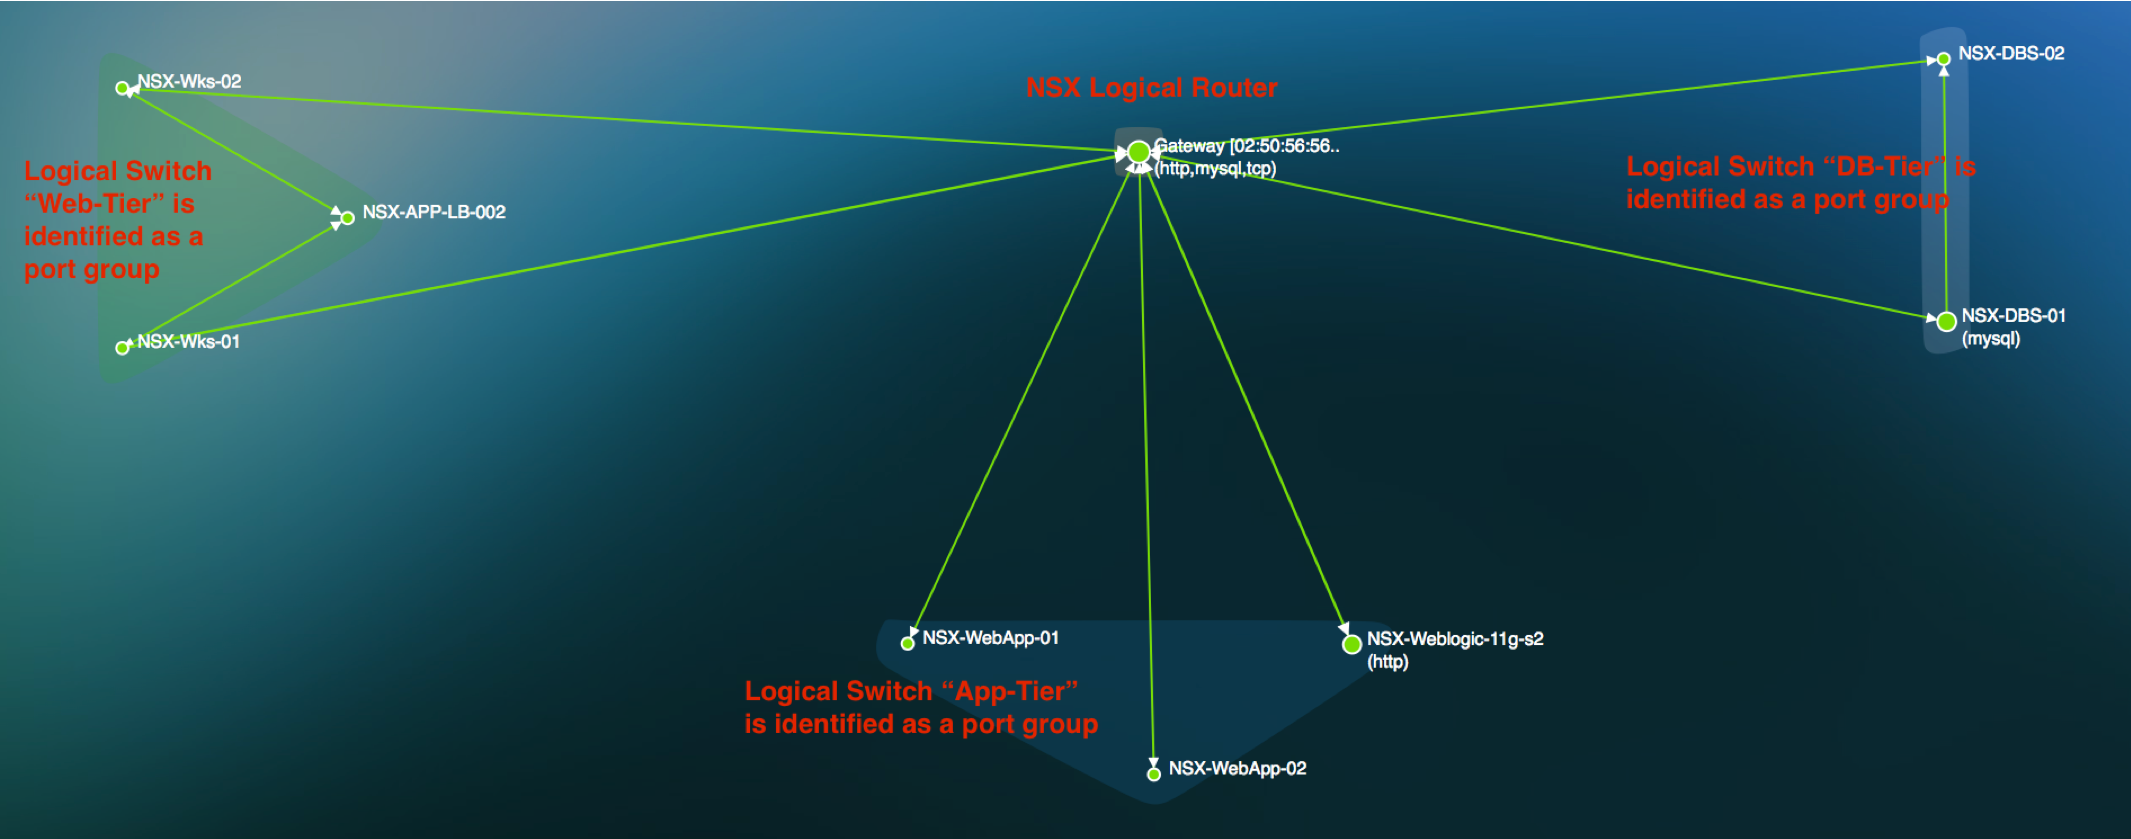
- Reduced Time to Value with automatic discovery of the topology map for your microsegmented environment.
- Troubleshoot issues proactively at lightning speeds with full visibility into the dependencies. View each application service performance by its response time and transaction load on the associated VMs.
- No manual updates or interventions needed to build the Dependency mapping. Install Uila, and we will build the maps automatically with NO code changes needed.
- Key Performance Indicators such as Application Response Time, Transaction Volume, packets, etc. for every application discovered.
- Packet Capture Network Traffic for any selected Application.
Leverage existing Network Packet Broker (NPB) Infrastructure and Investment
- Leverage your existing Network Packet Broker (Niagara Networks, Ixia, etc.) infrastructure and investment by forwarding network traffic from the NPB to Uila's Virtual Smart Taps.
- Add much needed visibility for Application Performance based on Deep Packet Inspection of the network traffic.
- Combine north-south and east-west traffic in a single network traffic analysis view. Get full access to KPIs such as bandwidth, transaction volume, drops, retries, etc.
- Troubleshoot network issues proactively at lightning speeds with full visibility and bottleneck detection across the full-stack and all infrastructure dependencies. Uila's dependency maps are generated automatically, and without any agent deployment.
Click here for more details on Uila's Integration with Niagara Networks
Uila-Niagara Networks Integration
Full Stack Observability in a Single Product
- Align business and IT Operations goals in a single product with application visibility and correlated network, compute and storage insights
- Full stack visibility (Application Performance Monitoring, Infrastructure Performance Monitoring, Network Monitoring, Storage Monitoring) for virtualized data centers reduces troubleshooting time from days to minutes, enabling lean IT teams to get time back for more strategic projects
- Identify blind spots in the infrastructure, and eliminate finger pointing between infrastructure and application teams with automated root cause and forensics.
Resources
-
Uila Network Monitoring BriefQuick read on what Uila can offer on virtual and physical network infrastructure monitoring.
-
School District cuts Troubleshooting time by 50%Success Story on how a school district cut their troubleshooting time with Application-centric Network Device Monitoring.
-
How Networking Impacts Your Data Center ApplicationsRead this blog to identify networking issues that could impact your application delivery.
-
Network Performance Monitoring with UilaQuick product video on how to use Uila for Network Performance Monitoring
-
6 things missing in NPM toolsNetwork performance monitoring remains an essential tool for network and IT operations managers, but it’s no longer sufficient for modern IT infrastructure.
-
2017 Next-gen Software-defined (SDx) Infrastructure Assurance ReportUila featured in the 2017 Next-gen Software-defined (SDx) Infrastructure Assurance Analyst Report
-
Detecting Virtual Packet Drops with UilaVideo on Uila Identifying Virtual Network Packet Drops.
-
Crack that egg – Limitations of traditional networking solutionsIn this blog, dcdummy.com talks about the challenges with traditional monitoring solutions in today's world
Ready to begin your Monitoring Journey with Uila?
Start a 30-day Free Trial Now
Request Trial


