Full Stack Observability in a Single Product
- Full stack visibility (Application Performance Monitoring, Infrastructure Performance Monitoring, Virtual and Physical Network Monitoring, Storage Monitoring) reduces troubleshooting time from days to minutes, enabling lean IT teams to get time back for more strategic projects
- Align business and IT Operations goals in a single product with application visibility and correlated network, compute and storage insights to solve problems before end-user impact.
- Reduce time in War-room conversations and instead focus on business acceleration projects.
Agentless & Seamless Discovery for over 4,200 applications
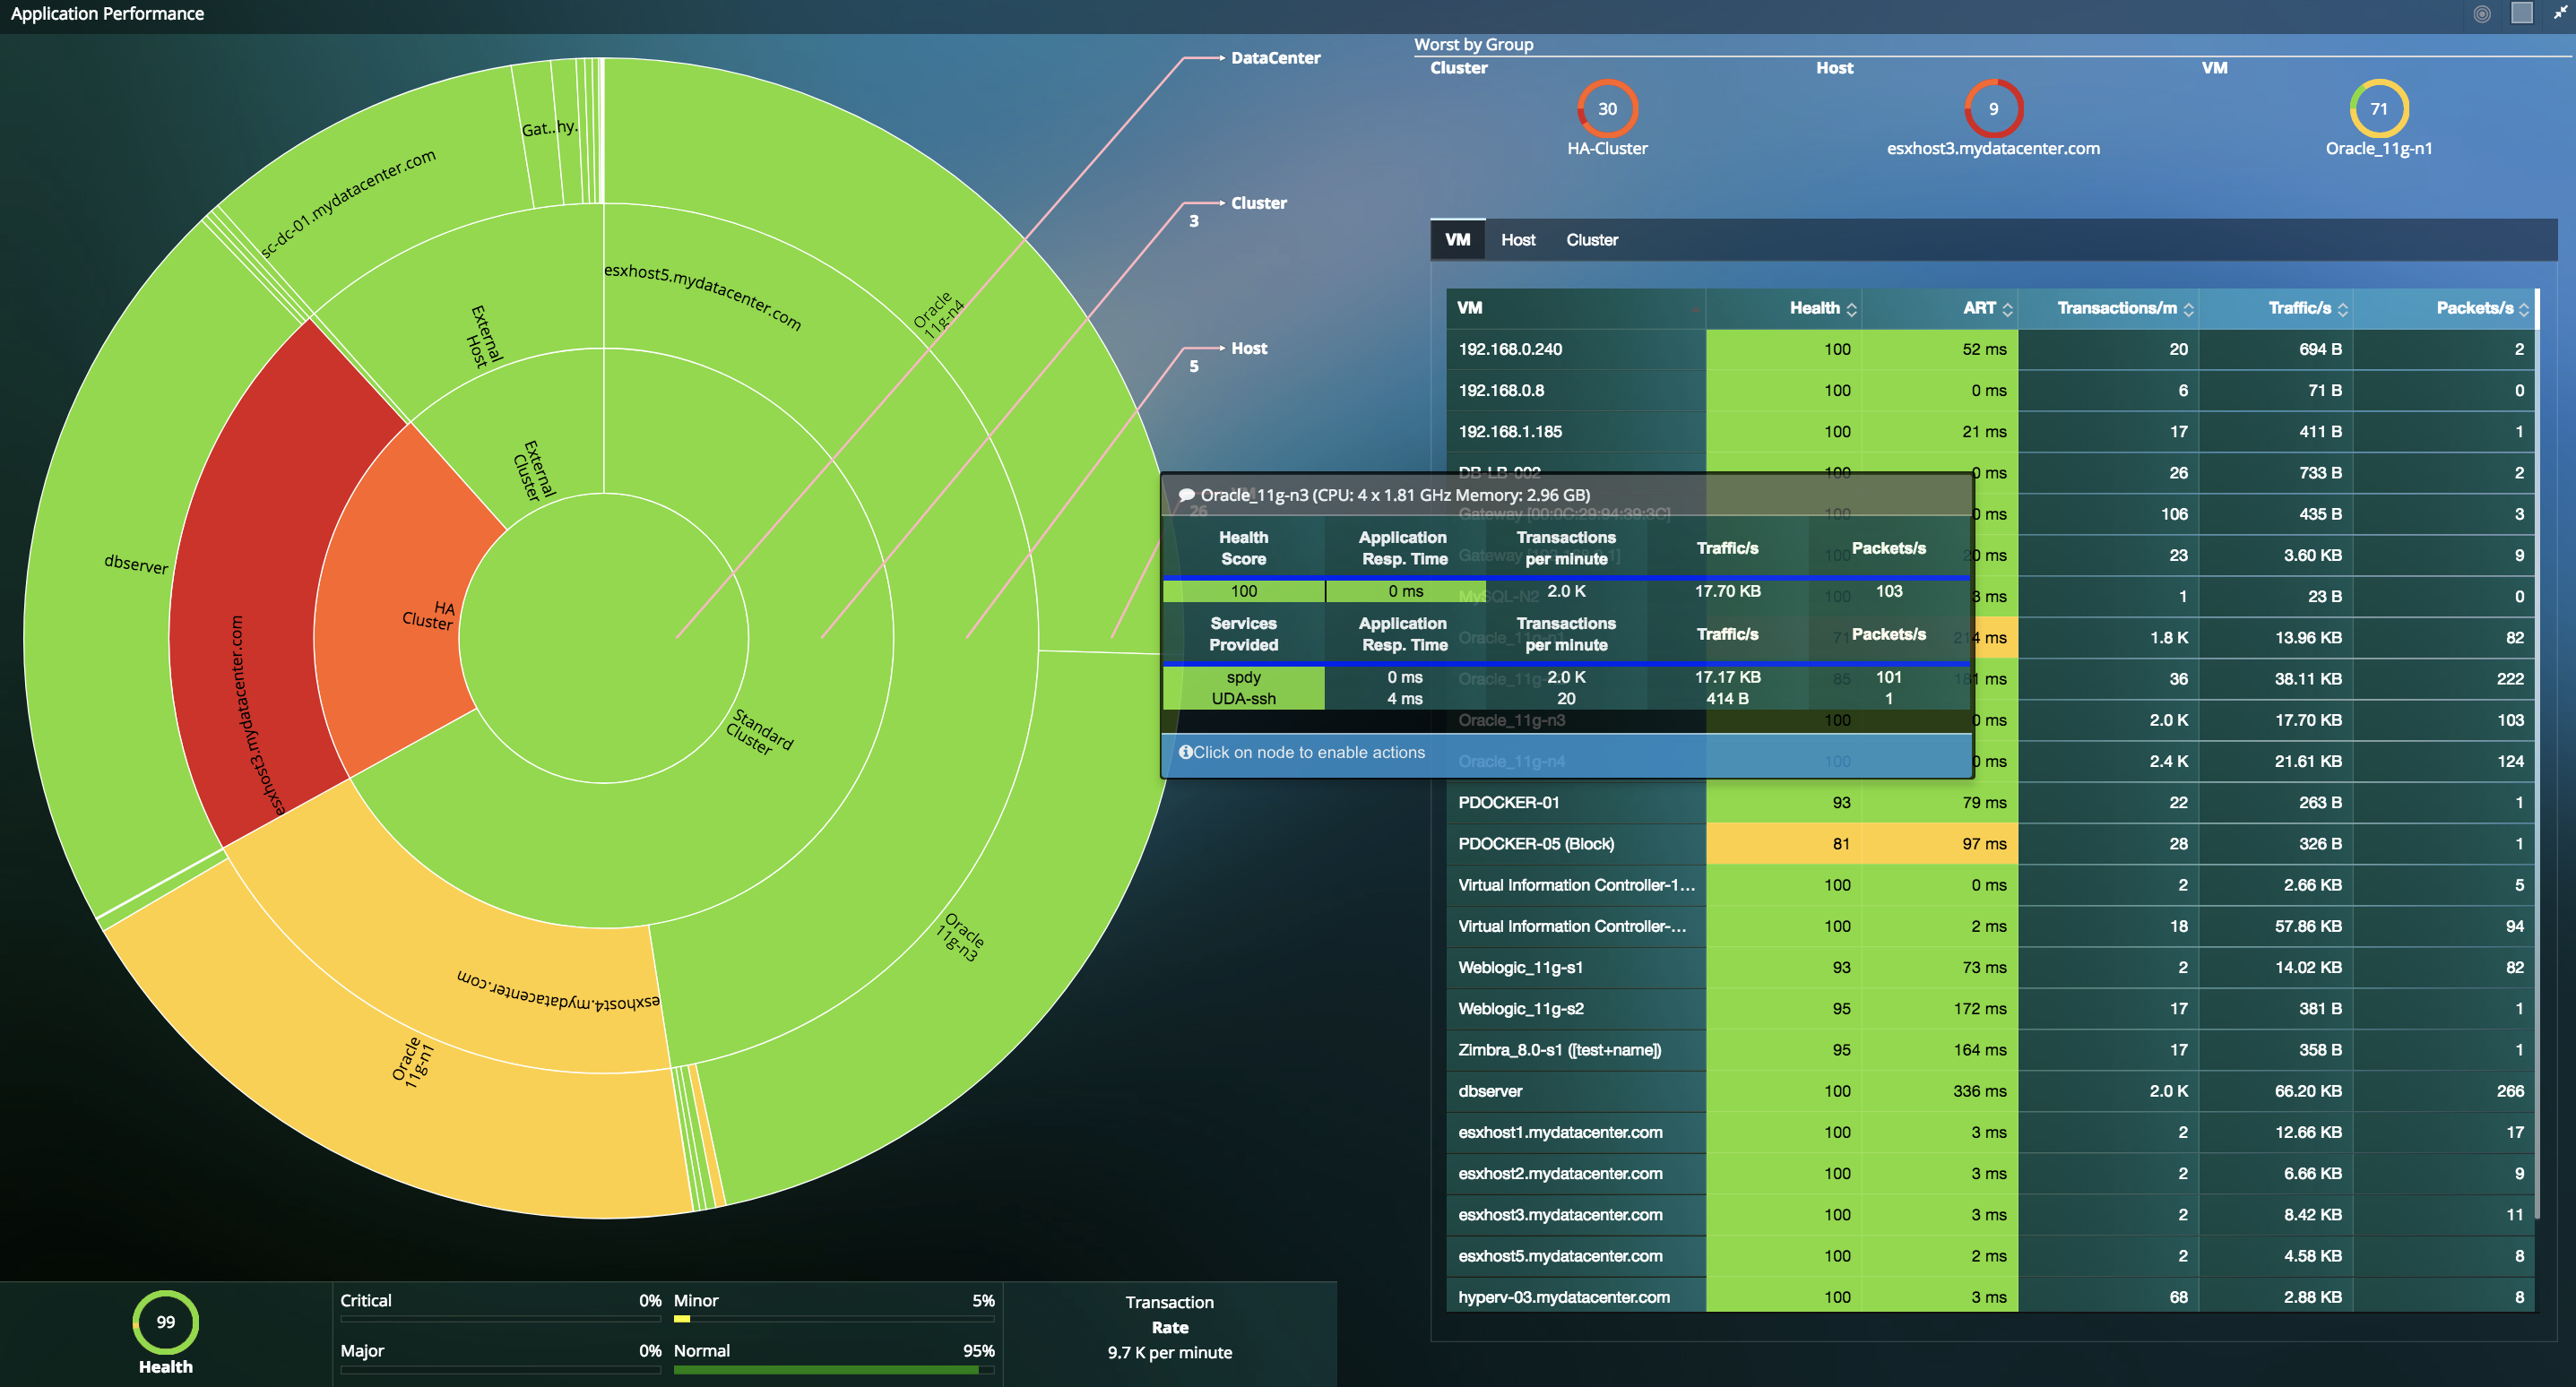
- Application auto-discovery for over 4,200 applications (Web, Database, Saas, ERP, Healthcare, Financial, Building Automation, Industrial, etc.) with deep packet inspection.
- Review Application Response times, Transaction volume and Traffic volume for each individual application without interfering with their existing processes and services.
- Automated DPI to classify previously unknown traffic using embedded machine-learning algorithms.
- IT teams can identify blind spots in the infrastructure, and eliminate finger pointing between infrastructure and application teams with automated root cause and forensics.
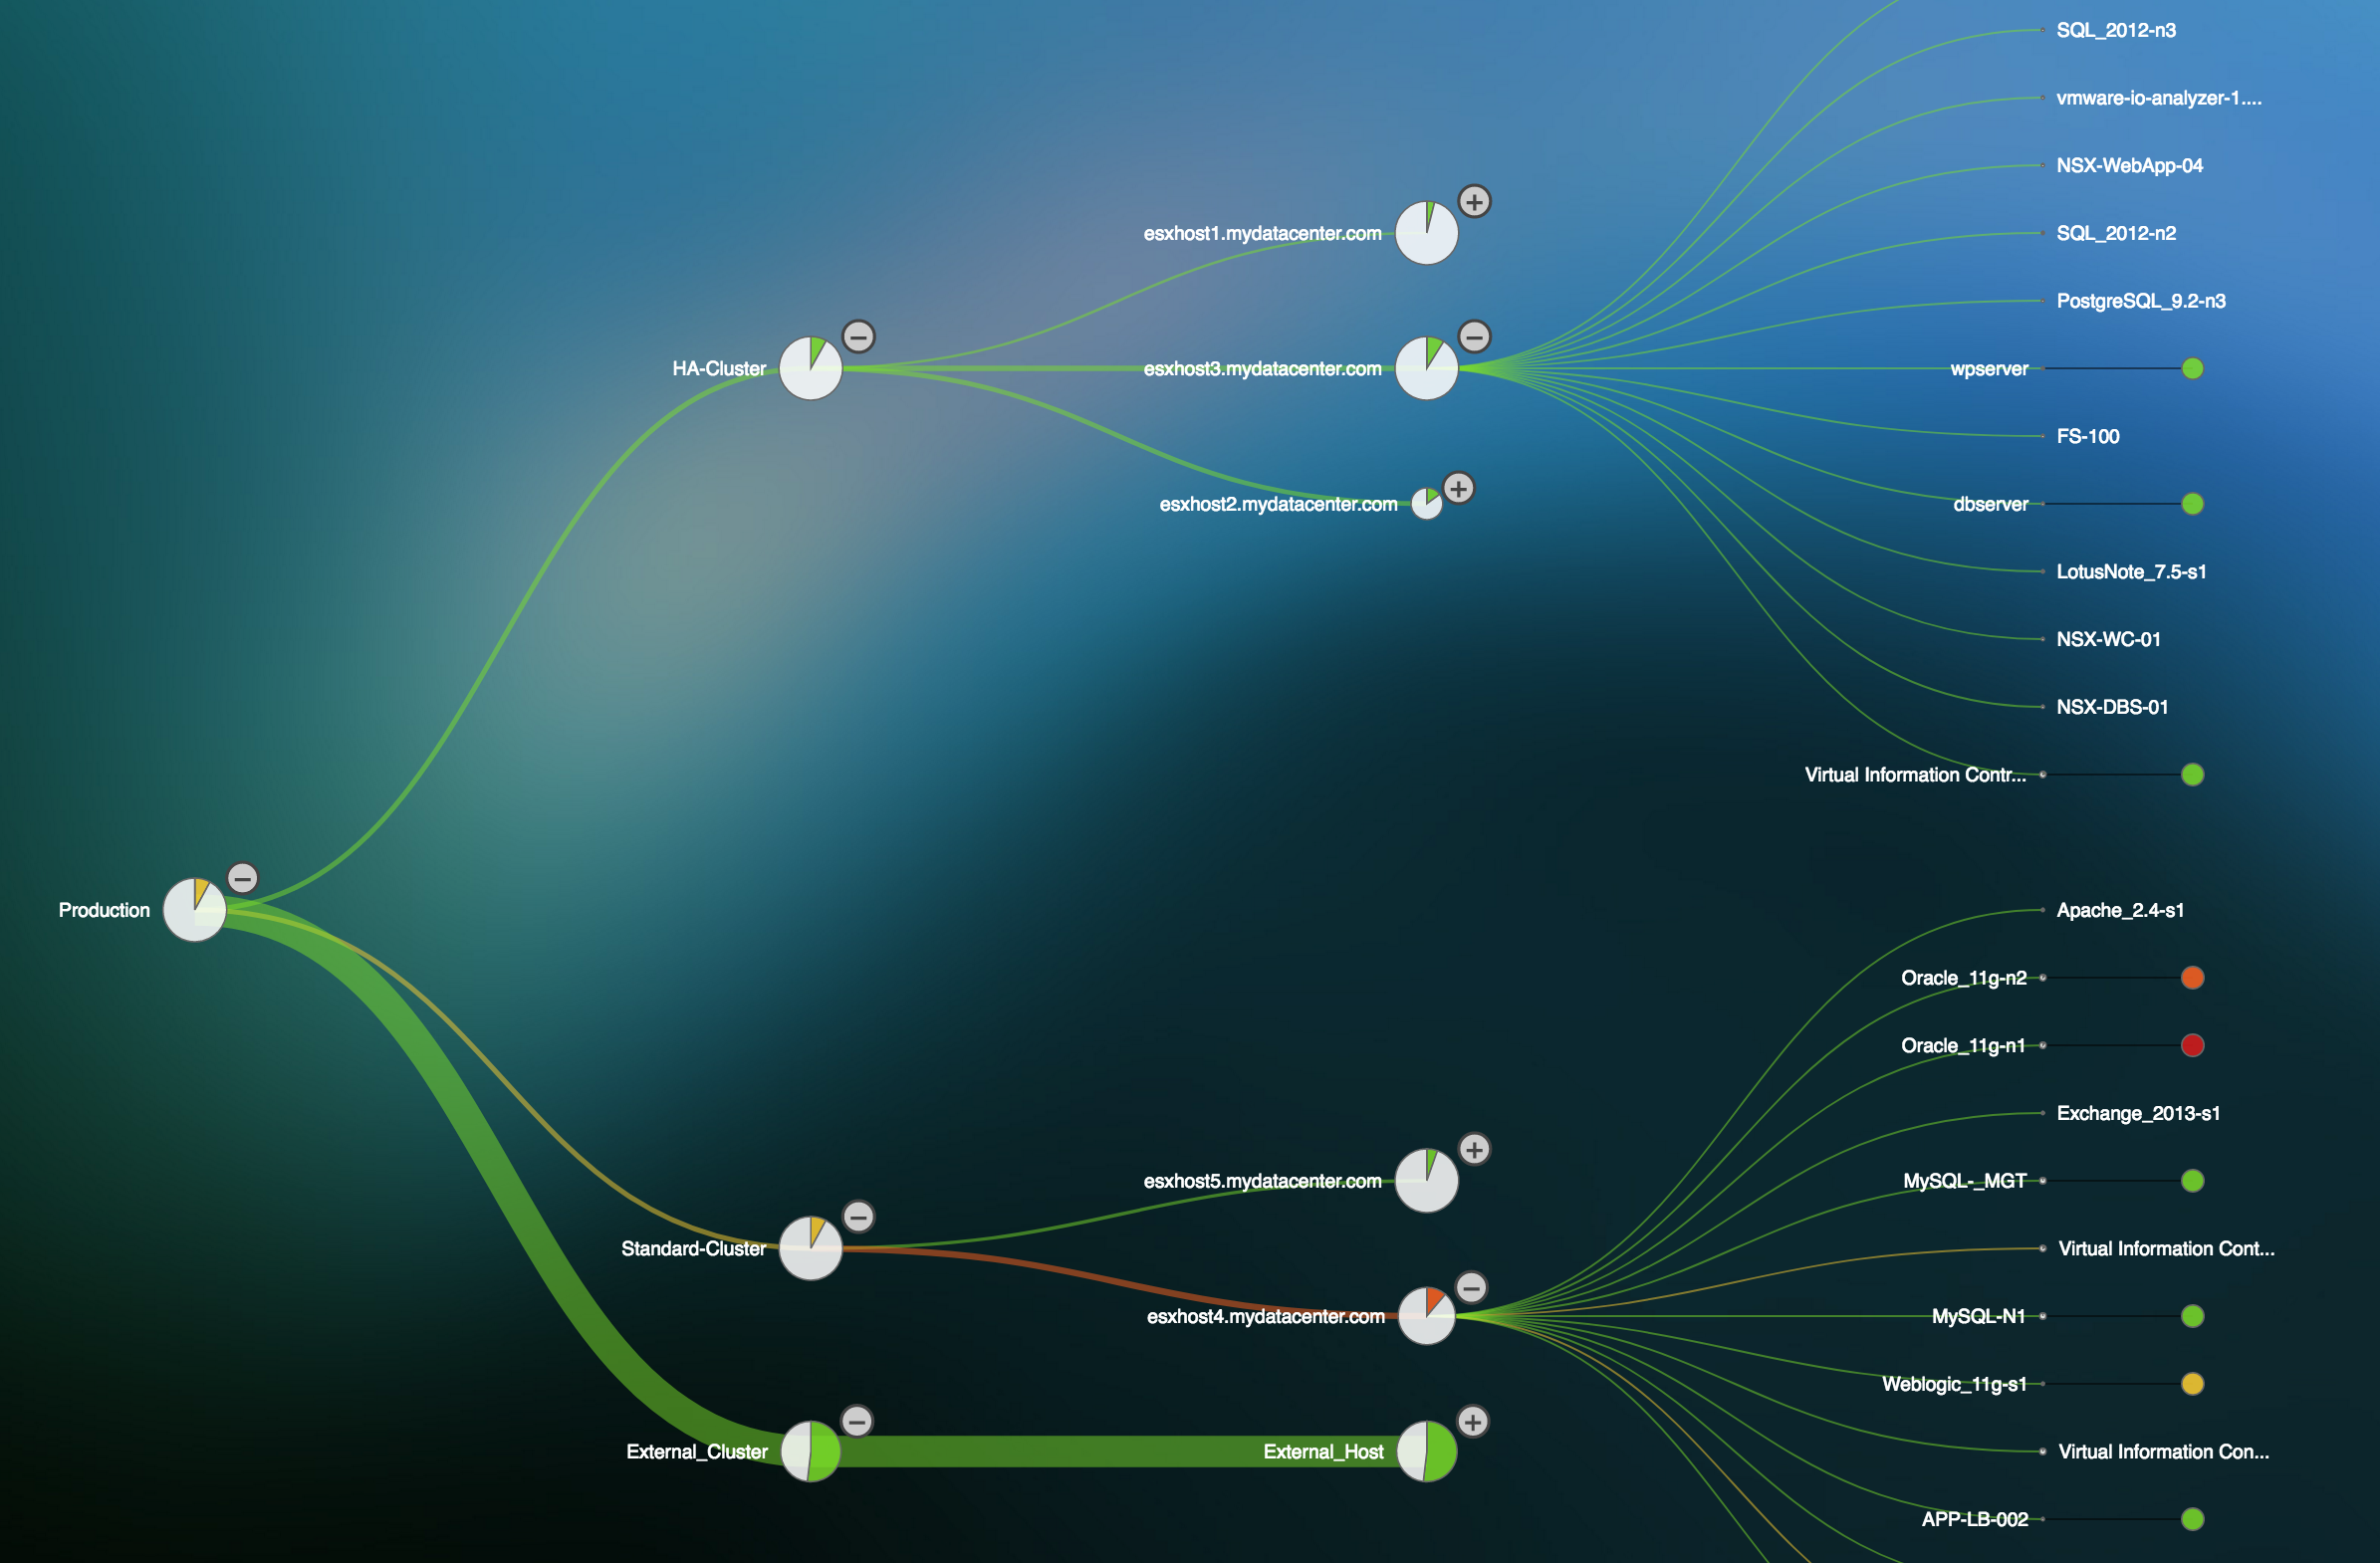
Real-time Application Dependency Mapping
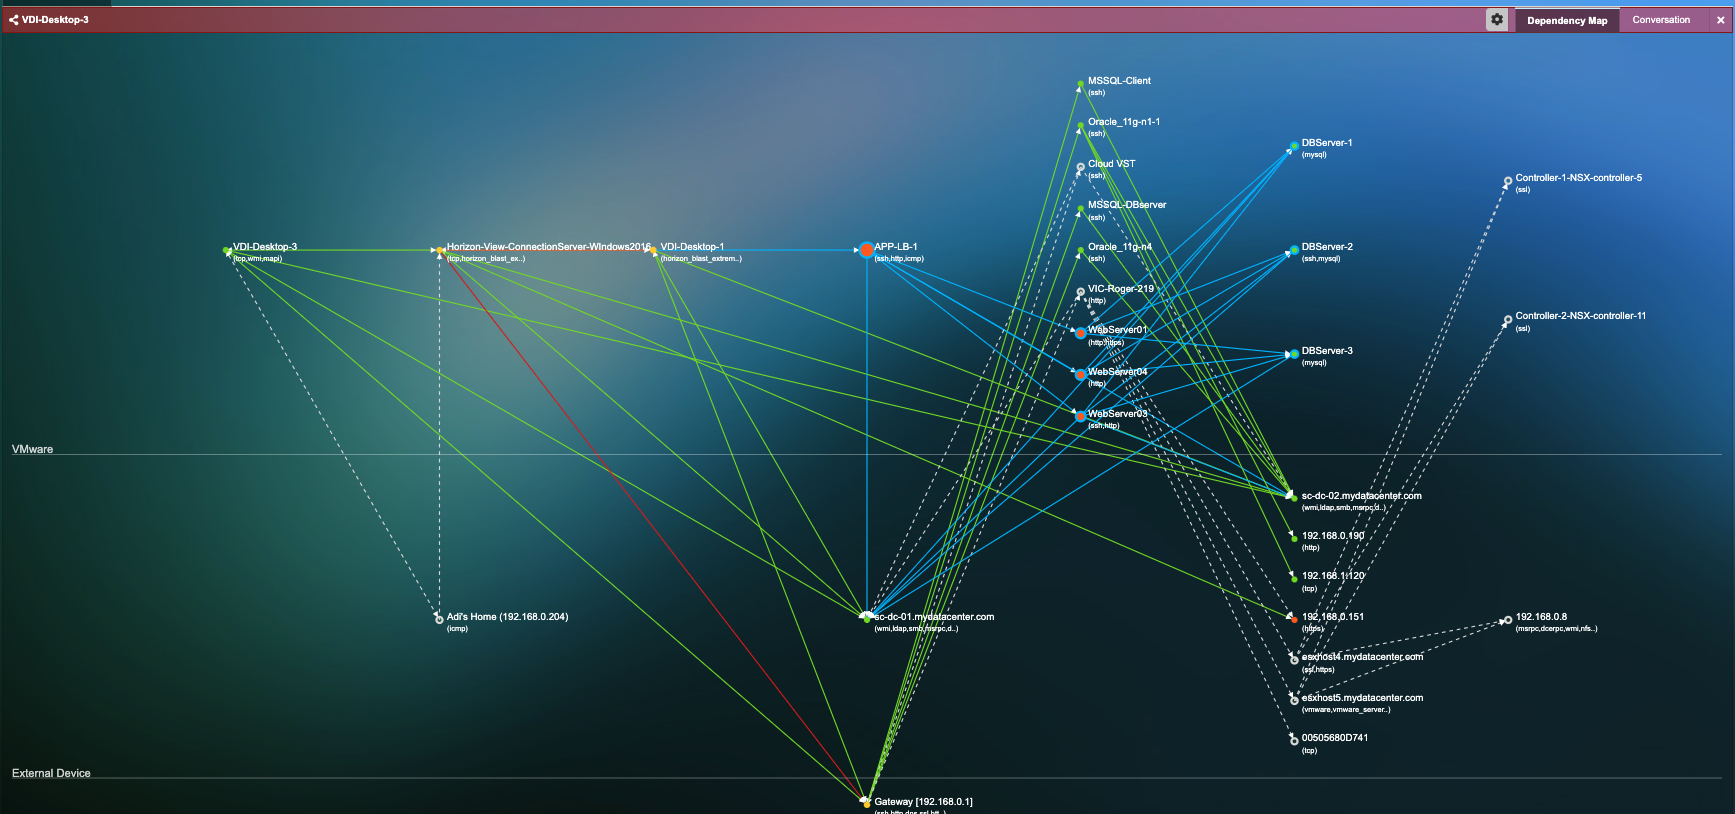
- Automated and Real-time end-to-end Application Dependency Mapping.
- Isolate troublespots in the dependency chain and get to root-cause due to Application, Infrastructure or Network.
- Export results to Excel and CMDB systems for records/policy management and strategic projects like Cloud Migration and Data Center Consolidation.
- Insights into application dependency anomalies, indicating security and policy violations.
Automate IT Operations with Intelligent Remediations & Reduce Unplanned Downtime by 70%
- AIOps to streamline troubleshooting and reduce MTTR with remediation actions across the infrastructure, including VDI. Intelligent Alert-based triggers and Manual triggers provide complete control in proactively preventing issues as well as streamlining problem resolution.
- Fully customizable PowerShell scripting to provide full remediation & configuration control for your entire-stack.
- Increase IT team efficiency and agility by automating repetitive tasks and focussing on issues that matter by reducing alert noise.
- Based on Uila’s full-stack ML-based Root-cause analysis that rapidly isolates issues. Actions include Power off VMs, Suspend VMs, Reset VMs, Power On VMs, logging off VDI users, Updating VMware tools, Restart Guest OS, Kill a process running on a VDI desktop, etc.
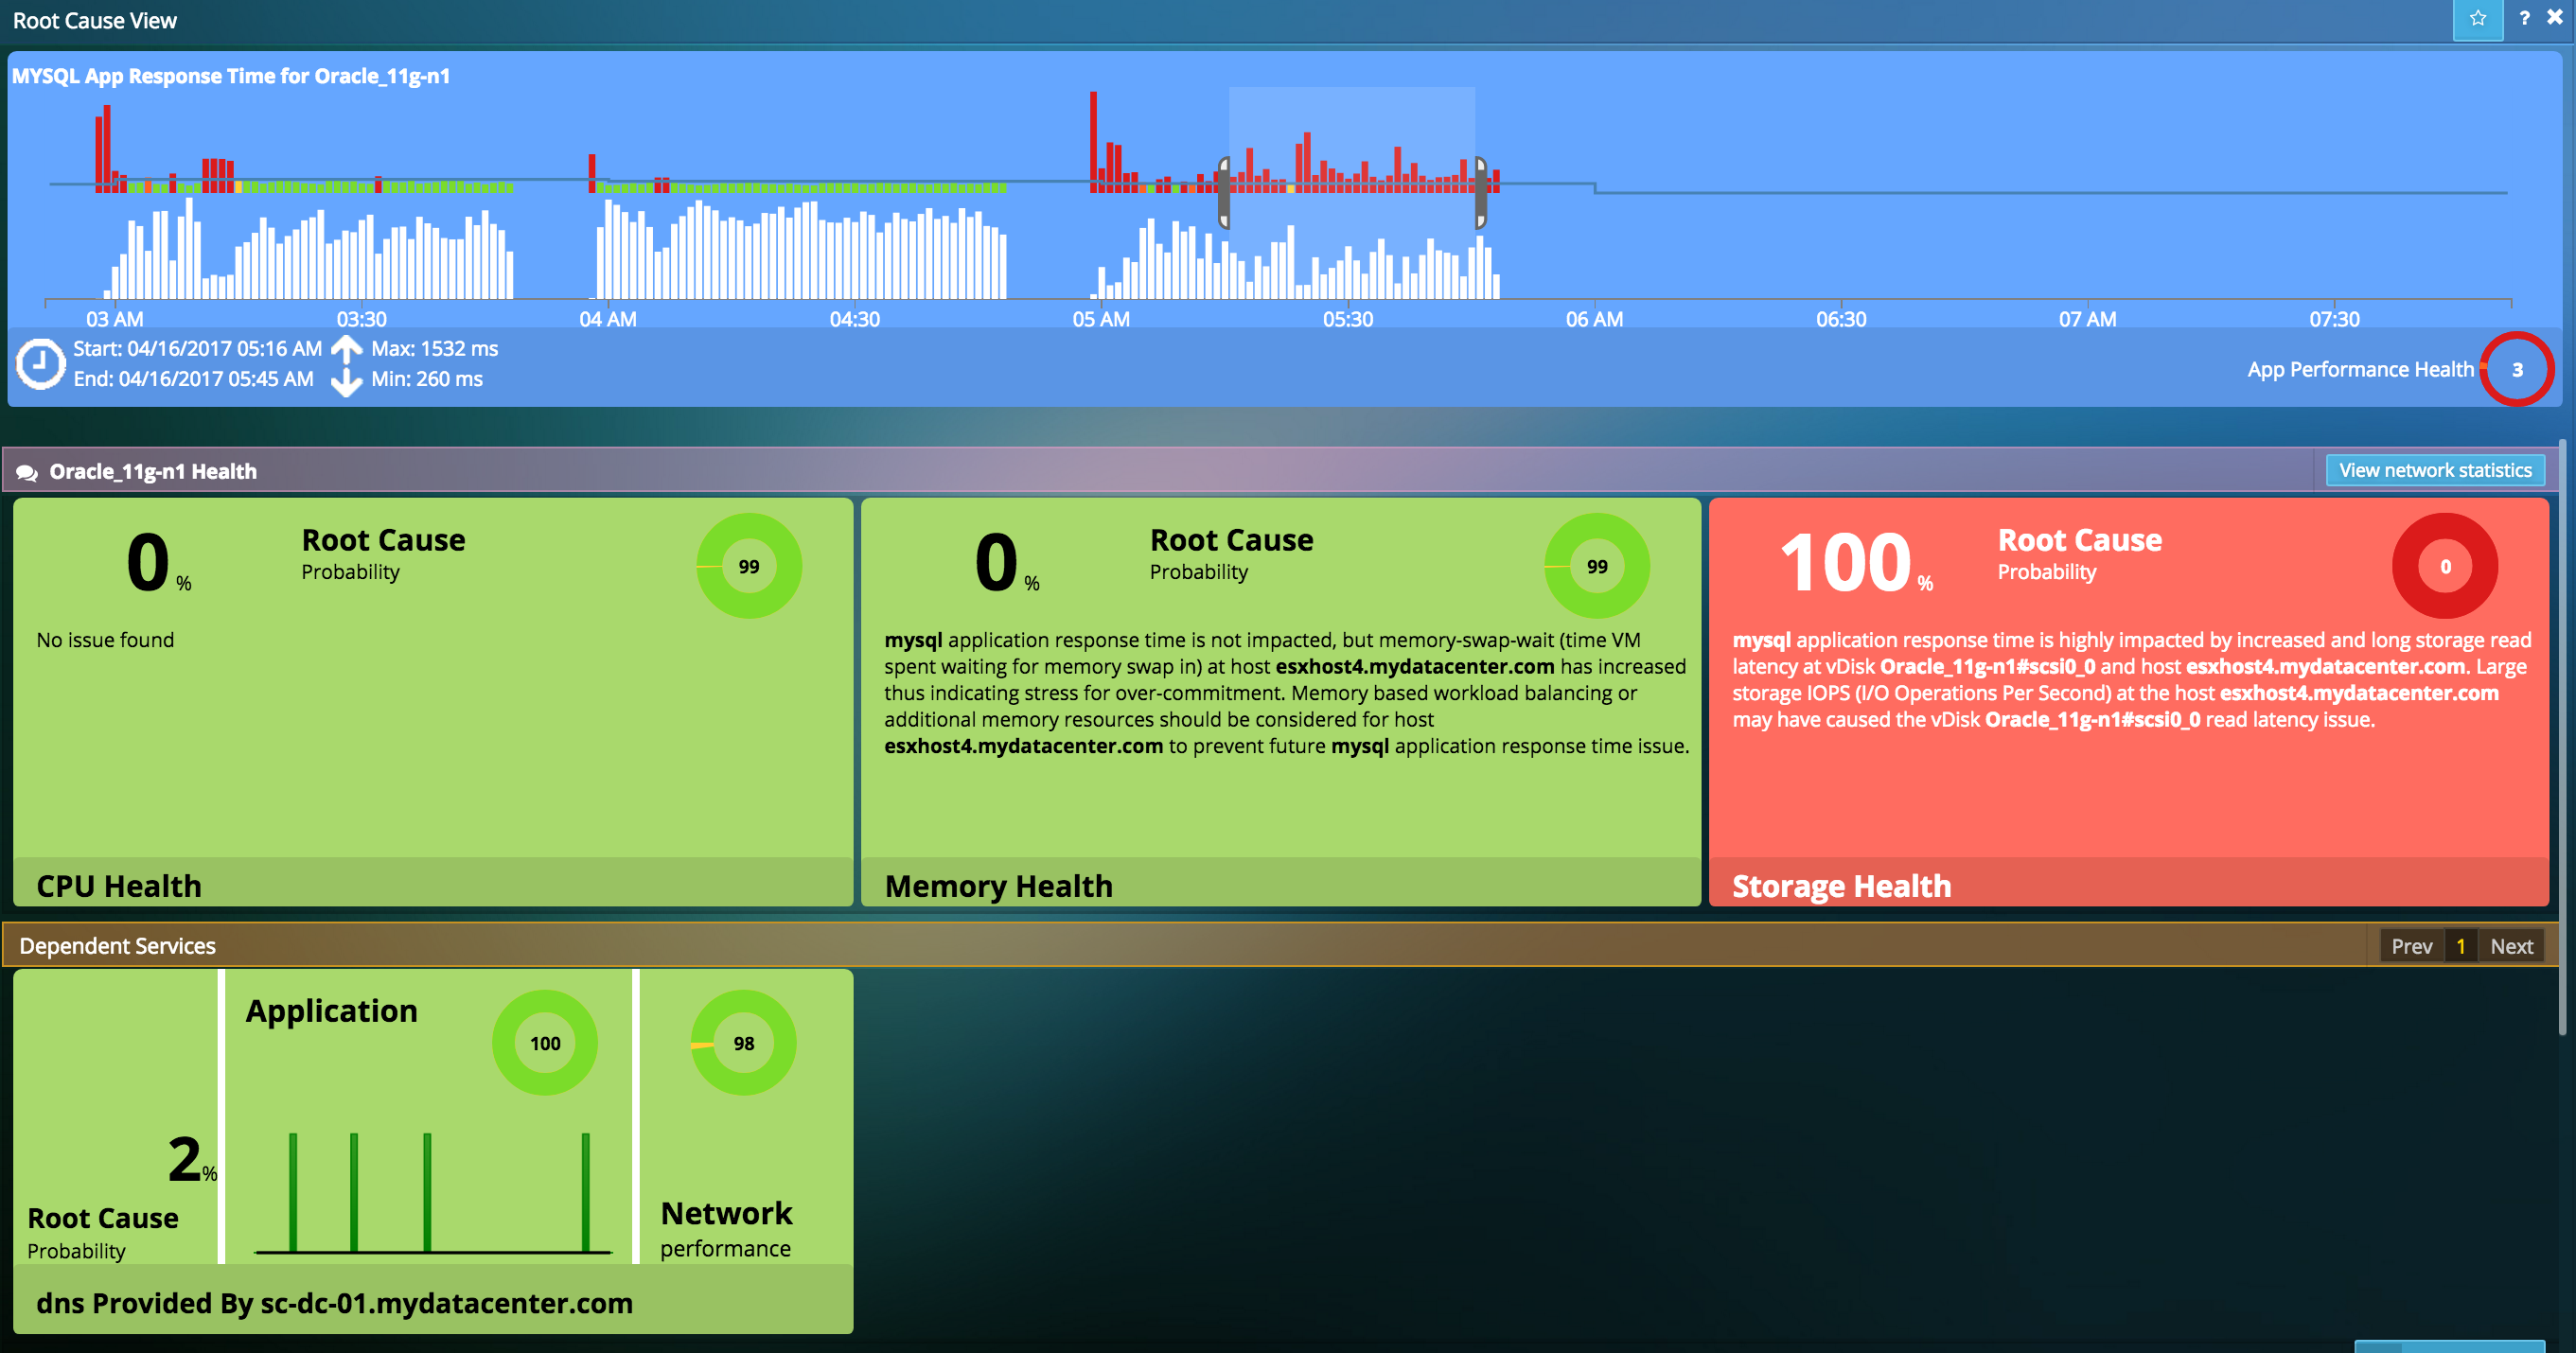
Troubleshoot at High Velocity with Root-Cause Analysis
- Monitor application performance and perform rapid root-cause analysis and reduce MTTR from days to minutes.
- Utilize continuous Machine Learning (ML) & Behavior Learning algorithms to identify anomalies from performance baselines instead of manual guesstimates, to provide unprecedented level of accuracy.
- Prevent alert storms and false positives with getting alerts only on issues that matter.
- No need to manually interpret issues from multiple sources. Let Uila do that for you.
- Real-time or time travel in the past to detect and solve intermittent issues.
Avoid finger pointing between IT teams with a shared view across the stack
- Eliminate finger pointing and encourage collaboration between IT teams to triage on an issue.
- Intuitive dashboard gives IT teams 1-click access to root cause of business service outages or performance degradations.
-
Get a holistic and clear view into performance problems before user impact.
- Exonerate the infrastructure with correlated full-stack evidence and avoid time-consuming and stressful fingerpointing.
- Application-to-infrastructure correlation bridges the IT troubleshooting gap.
Eliminate pain points within the Compute Infrastructure
- Visualize how compute performance impacts application performance by measuring metrics such as CPU swap wait, CPU Ready, Utilization and tie this to the Application Response Time.
- Visualize performance of all memory arrays in your hosts with respect to the infrastructure currently running in your data center. Get up-to-date information on memory usage, swap rate, swap wait times, etc.
- Detailed insights into processes using Compute resources.
- Guidance into solving under- and over-provisioned resource challenges.
Application-centric Virtual and Physical Visibility & Troubleshooting
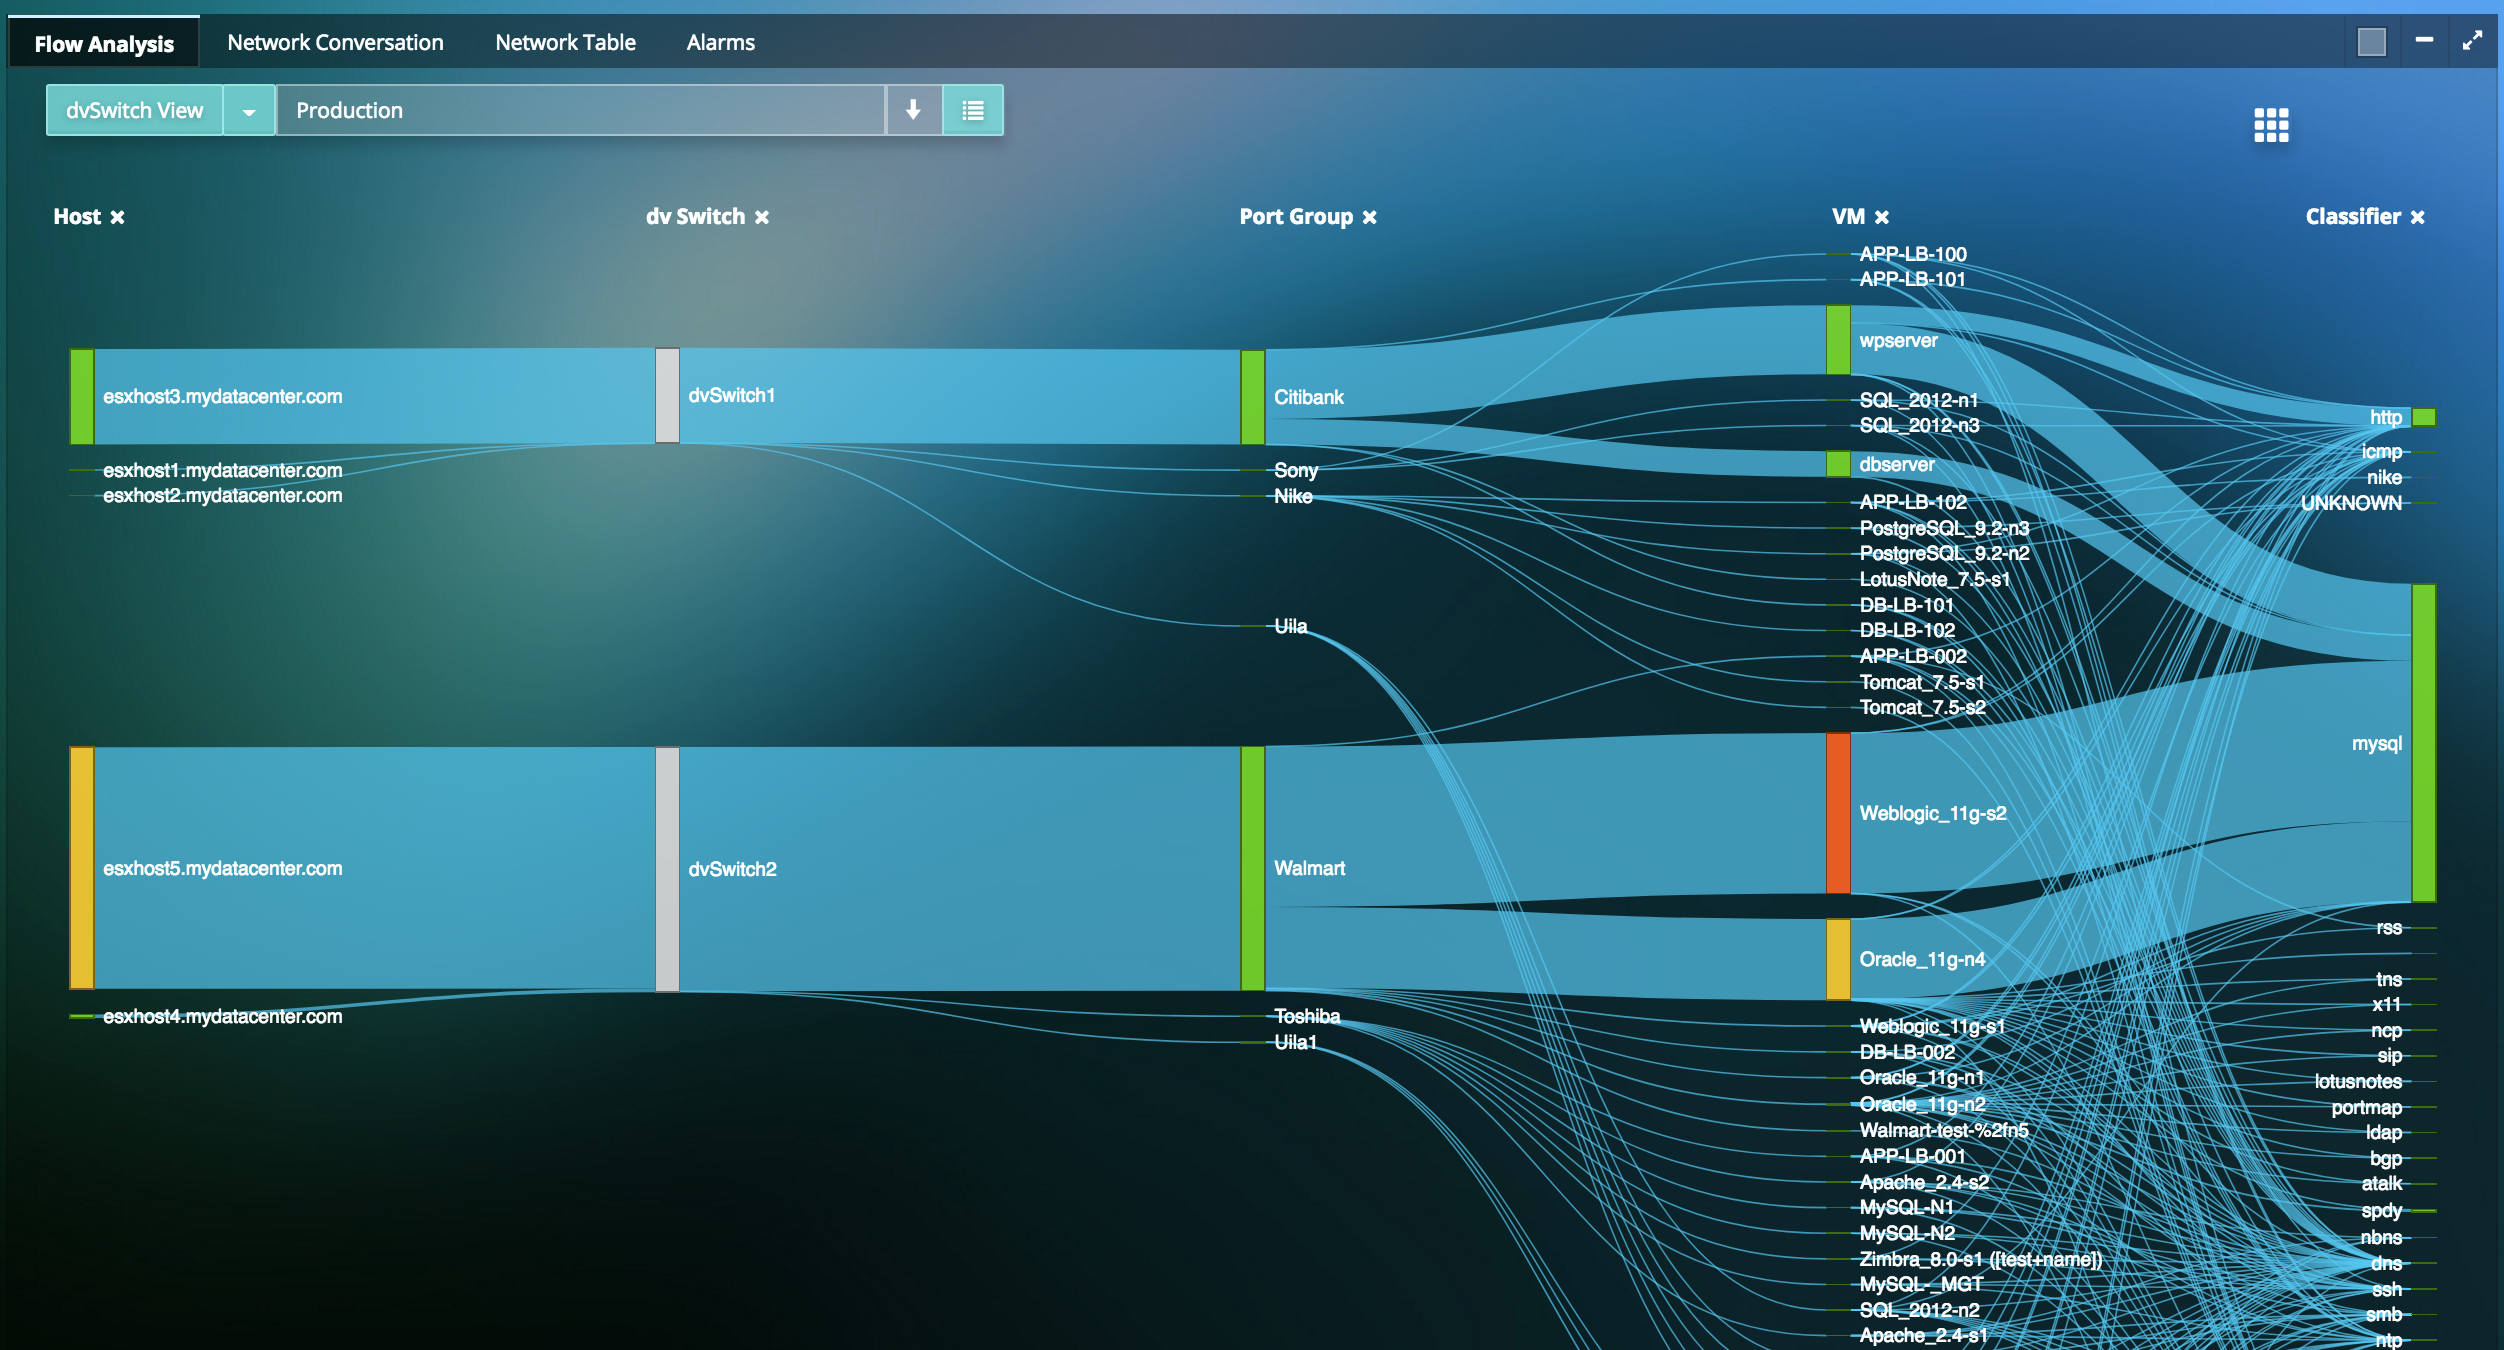
- Virtual Network flow analysis reveals network issues and stress impacting application servers.
- East-west (Lateral) network traffic analysis eliminates monitoring blind spots, and lets IT teams see anomalous traffic between VMs.
- Pinpoint application performance bottleneck down to the physical network port (unavailable, congestion, errors) directly from the Application Dependency Map.
- Get automatically alerted to network traffic violations.
Clear Bottlenecks and Weaknesses in Storage Performance
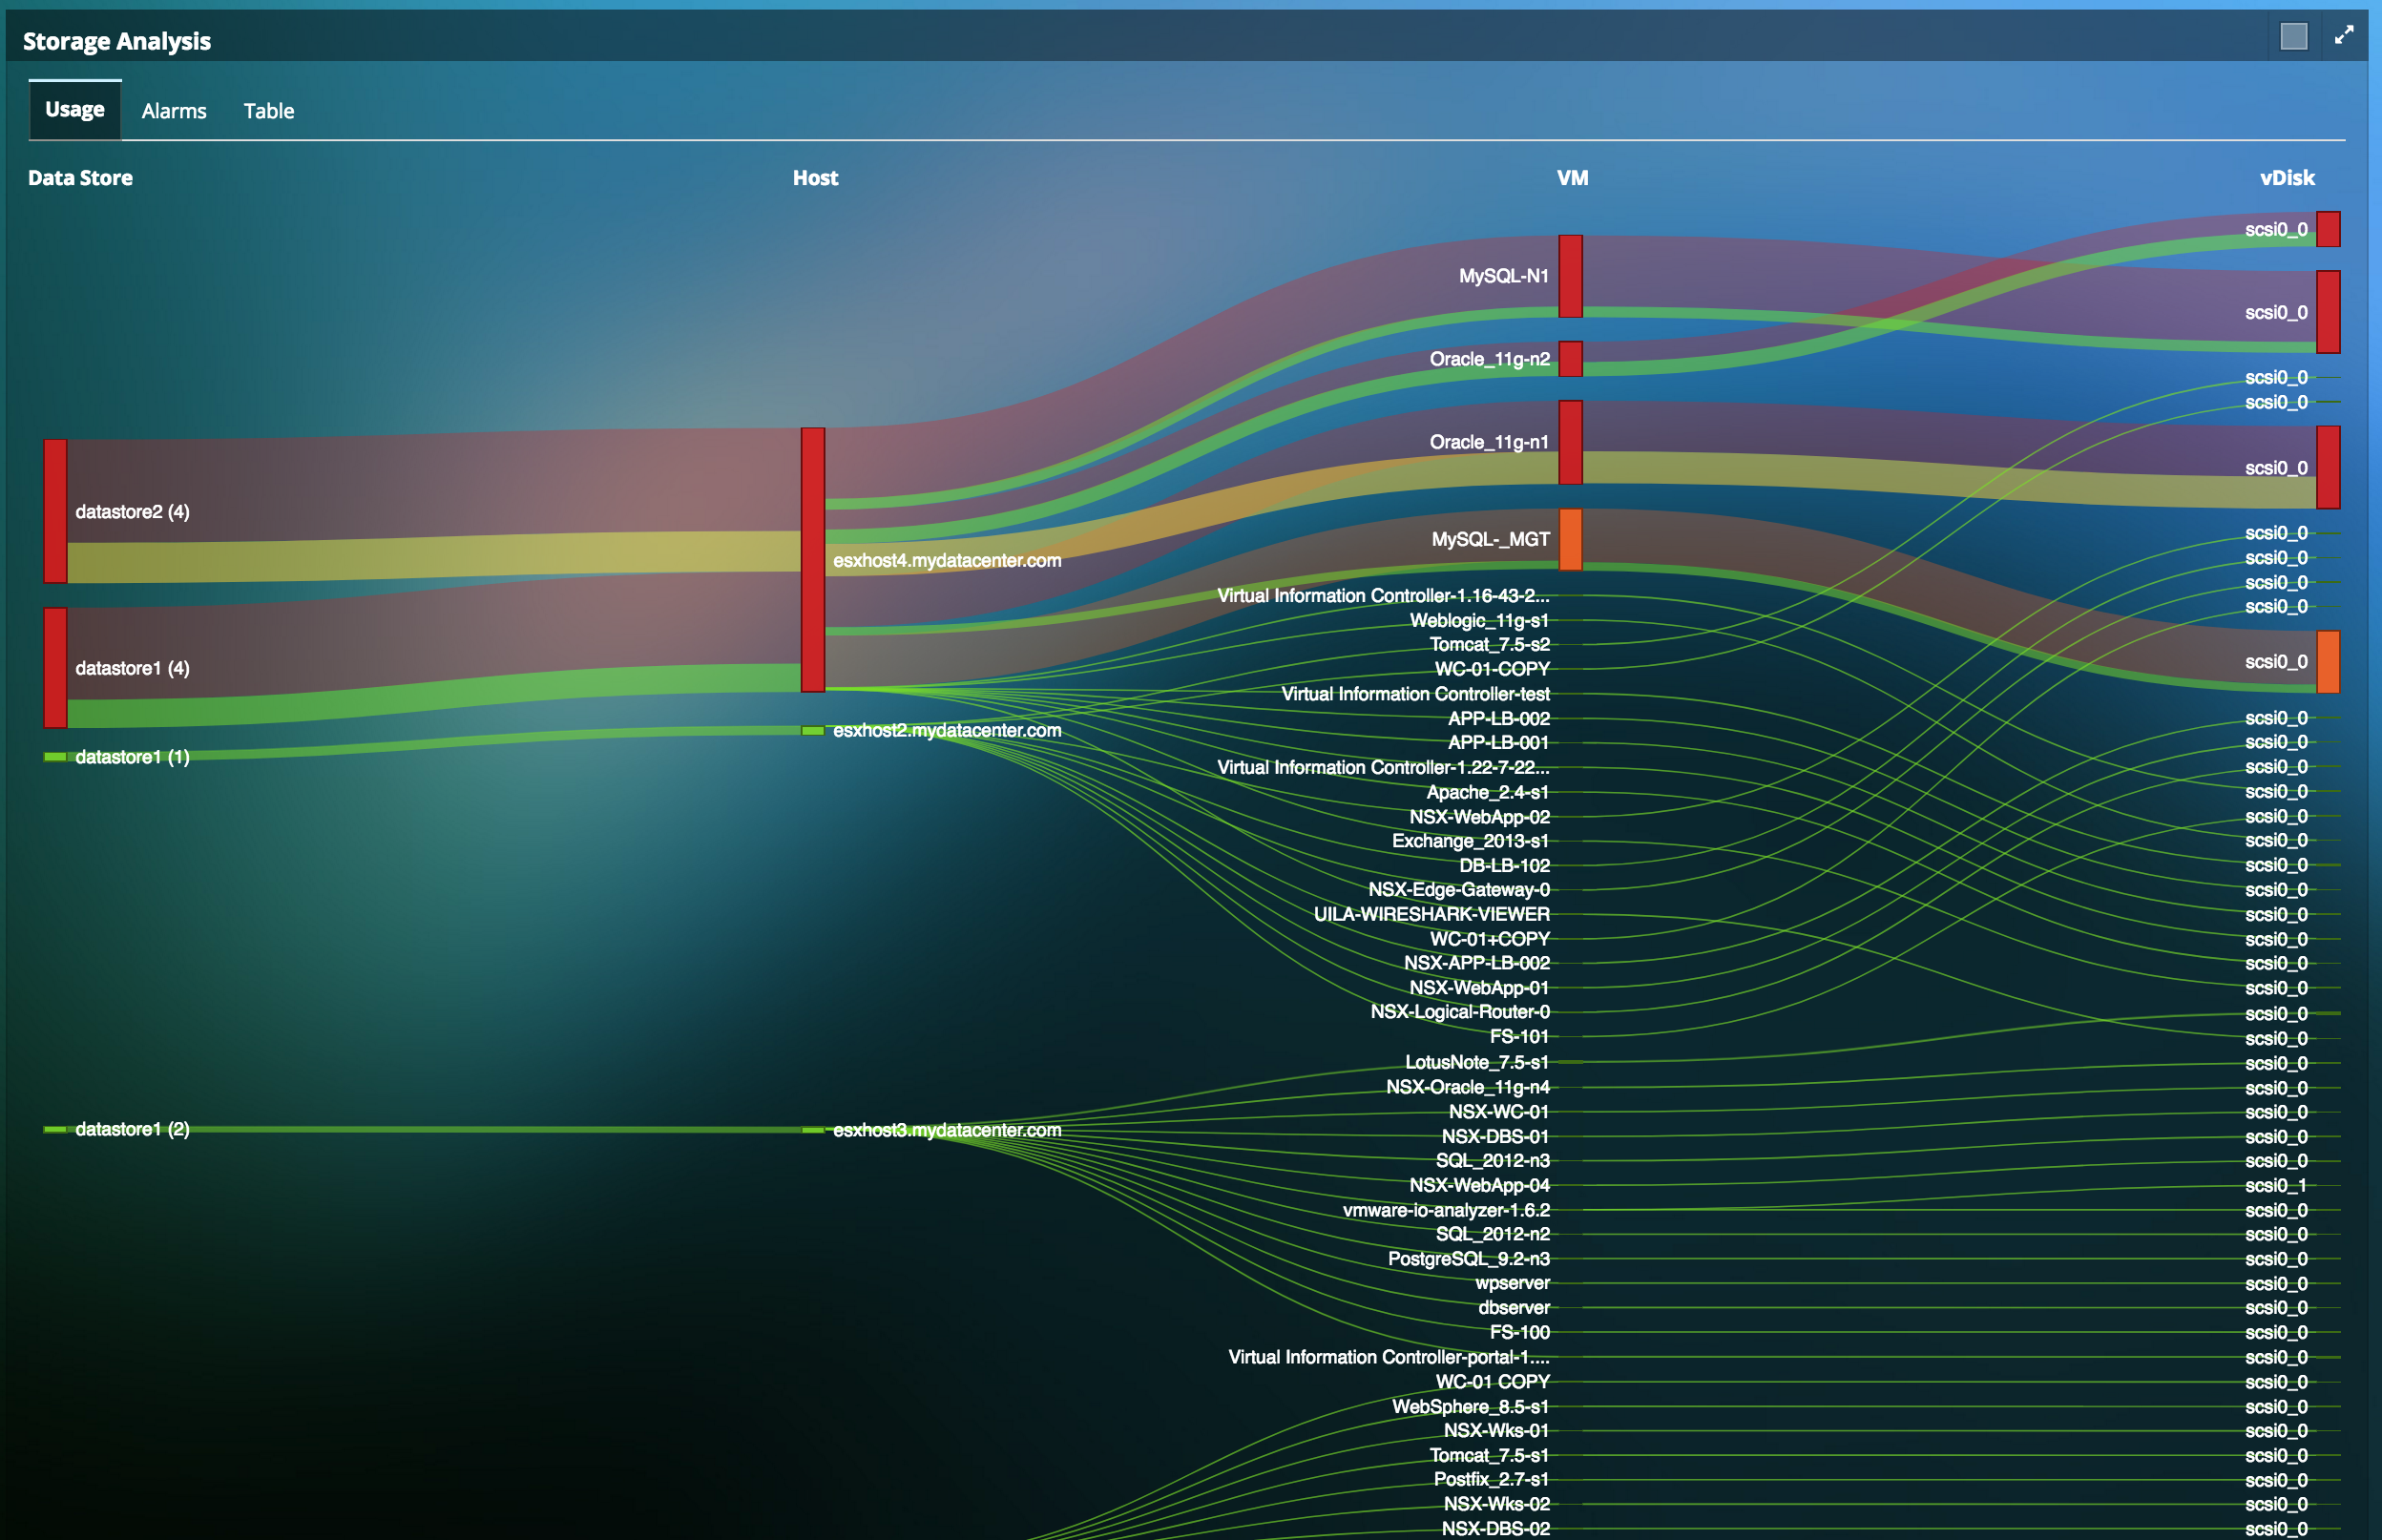
- Monitor Storage performance across multiple vendor’s storage arrays on a 24 x 7 basis and pinpoint issues all the way to the Datastore and Physical Disks.
- Visualize trending performance issues on Read/Write latencies and IOPS across VMs, vDisk and Data Stores.
- Get alerted to disk capacity challenges.
- Visualize how the overall storage infrastructure maps to applications, particularly with multi-tier applications.
Actionable Intelligence for Issues: Stop staring at dashboards to catch problems

- Identify and get alerted to issues rapidly, so you can resolve and restore services at lightning speeds.
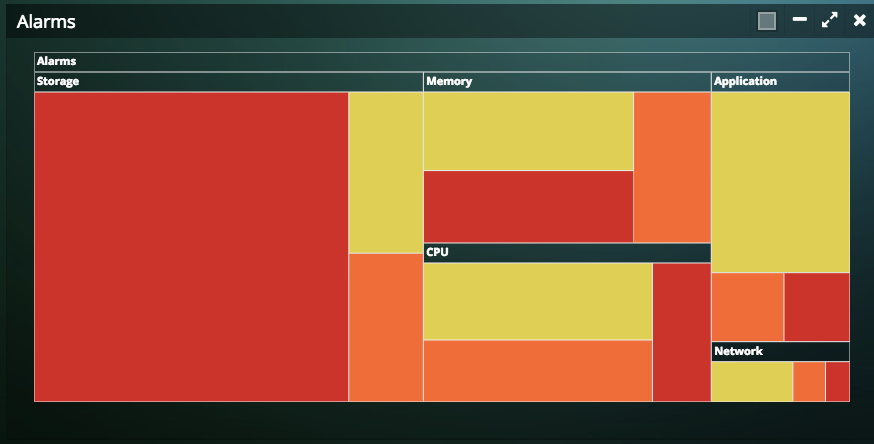
- Get alerted on Application, Infrastructure and Network issues impacting your business transactions
- Automatically identify abnormal changes with Dynamic performance baselining.
- Get automated email, syslog, SNMP alerts, Zabbix alerts, or automatically remediate the issue with Uila AIOPS.
Resources
-
Uila Success Story: Government Industrial Ministry accelerates resolution of critical Application slowness by 75%Success story on how an APAC-based Government Ministry focussed on Industrial development, accelerated resolution of critical Application slowness by 75%.
-
Uila Success Story: Government Healthcare Agency Protects Confidential Data by identifying Cyber AttacksGovernment Healthcare Agency Protected Confidential Data by identifying Cyber Attacks against critical applications, responsible for combatting the threat of communicable diseases.
-
Uila Success Story: Government Judicial Branch resolves Publishing System slownessSuccess story on how the Judicial Branch of the Government resolved frequent complaints on slow access to the Publishing System.
-
Uila Success Story: Hospital eliminates Patient Monitoring System Failures within minutesSuccess Story on how a Hospital based in APAC eliminated their repetitive Patient Monitoring System Failures within minutes using Uila.
-
Uila Success Story: Criminal-investigation and Counter-Intelligence agency improves User Response TimeSuccess story on how a Criminal-investigation and Counter-Intelligence agency improved User Response Time for their critical document management systems by over 80%
-
Importance of AIOps in Enterprise ITUila's VP of Marketing, Dilip Advani talks about AIOPs and the important role it plays in Enterprise IT.
-
IT Monitoring/Observability Tool ConsolidationQuick video that talks about the challenges of too many silo monitoring tools in an organization, and how they can be overcome with a tool consolidation effort.
-
Uila real-world use case: Troubleshooting Zoom conferencing challengesQuick video on how an enterprise organization used Uila uObserve to resolve multiple challenges with the Zoom conferencing application.
-
User Expectations from Hybrid Cloud MigrationQuick educational video on the expectations organizations have from Hybrid Cloud Migrations.
-
Harris County Clerk Office Success StorySuccess Story for Harris County Clerk Office (3rd largest county in the United States) where Uila helped them discover and solve Application & Infrastructure problems 30% faster.
-
Insurance Group Success Story on solving Guidewire Application issuesSuccess Story for a large Insurance group on solving Guidewire insurance platform issues.
-
Construction Equipment Dealer Success StorySuccess Story for Construction Equipment Dealer where Uila helped them solve the problems with their business critical CRM server, and eliminated past downtimes that impacted customer relationships, pricing and record information.
-
Root-Cause Based Troubleshooting with UilaQuick product video on how to use Uila to get to Root Cause for Availability & Performance issues across Private & Hybrid Cloud environments.
-
Carolina Biological Success StoryWatch how Uila helped Carolina Biological resolve their Application slowdown complaints.
-
Solving the Top 5 Virtualized Application & Infrastructure Problems White PaperSolving the Top 5 Virtualized Application & Infrastructure Problems by David Davis- ActualTech Media
-
Multinational Telecommunications company Success StorySuccess Story for a top US-based Multinational Telecommunications Company where Uila helped their R & D division shorten the development cycle and reduce MTTR for issues by over 40%.
-
vCPU over Provisioning Video with UilaWatch Uila’s Identifying vCPU over Provisioning Video.
-
Noisy Neighbors Detection with UilaQuick video on how Uila detects noisy neighbors (application or virtual machine that uses the majority of available resources and causes network performance issues for others on the shared infrastructure).
-
What is Full-Stack Visibility?What is Full Stack Visibility - an interview with Chia-Chee Kuan by ActualTech Media
-
Full Stack Visibility: What does it truly reveal?Read about how Full-Stack Visibility gives IT teams the necessary insights to solve application performance issues in your virtualized data center.
-
What is Application-centric IT?Uila CEO Chia-Chee Kuan talks about Application-Centric IT.
-
What Should a Full-Stack Monitoring Solution Do?Infographic on what full-stack visibility solutions do and why they are a requirement for every IT organization.
-
Digital Transformation Success with MonitoringRead blog by Theresa Miller published on 24x7ITconnection on critical insight into why monitoring solutions are necessary for successful IT Digital Transformation.
-
Analyst view on Full-Stack MonitoringWhitepaper on Advanced Data Center Management with Integrated, Full Stack Monitoring by Edwin Yuen, Analyst, ESG
-
Full Stack Monitoring with UilaQuick product video on how to use Uila for Full Stack Monitoring.
-
2017 Next-gen Software-defined (SDx) Infrastructure AssuranceUila featured in the 2017 Next-gen Software-defined (SDx) Infrastructure Assurance Analyst Report
-
A Datacenter With a View. Not with logging!!!In this blog we talk about how simple collection of logged data is not enough to get true visibility into a Hybrid environment.
-
Uila Proves Critical to Lake EMS Virtual Data Center VisibilityUila’s Solution becomes critical tool for data center visibility and rapid application root cause analysis
Ready to begin your Observability Journey with Uila?
Start a 21-day Free Trial Now
Request Trial


