80% Faster Triaging of End-to-end Service Outages & Poor Performance Issues across Hybrid Cloud
- Unified Interface for isolating and resolving complex IT disruptions with correlated metrics across the Virtual/Physical Data Center & Public Cloud deployments. Eliminate unplanned outages that may cost up to $750k/incident (as per Ponemon Institute)
- Avoid legacy "silo-based" troubleshooting methodologies (switching between tools, manually comparing data) used by IT Operations and Application/DevOps teams, which only report symptoms instead of root-cause. uObserve's unified view enables colloboration across IT teams to increase team productivity and accelerate MTTR. Bring together diverse IT teams to resolve complex IT problems and disruptions.
- Built-in End-to-end Application,Infrastructure and End-user Expert system gives IT teams 1-click access to root cause from the Dependency Maps and remediation steps for unplanned business service outages or performance degradations.
- Pinpoint rootcause behind unplanned downtime or slowdowns, including application, infrastructure & virtual or physical network in a single unified view.
- Solve problems from the end-user's perspective in addition to proactive monitoring to solve problems before they occur.
Read More
Automate IT Operations with Intelligent Remediations & Reduce Unplanned Downtime by 70%
- AIOps to streamline troubleshooting and reduce MTTR with remediation actions across the infrastructure, including VDI. Intelligent Alert-based triggers and Manual triggers provide complete control in proactively preventing issues as well as streamlining problem resolution.
- Increase IT team efficiency and agility by automating repetitive tasks and focusings on issues that matter by reducing alert noise.
- Based on Uila’s full-stack ML-based Root-cause analysis that rapidly isolates issues. Actions include Power off VMs, Suspend VMs, Reset VMs, Power On VMs, logging off VDI users, Updating VMware tools, Restart Guest OS, Kill a process running on a VDI desktop, etc.
Uila Incident Savings Calculator
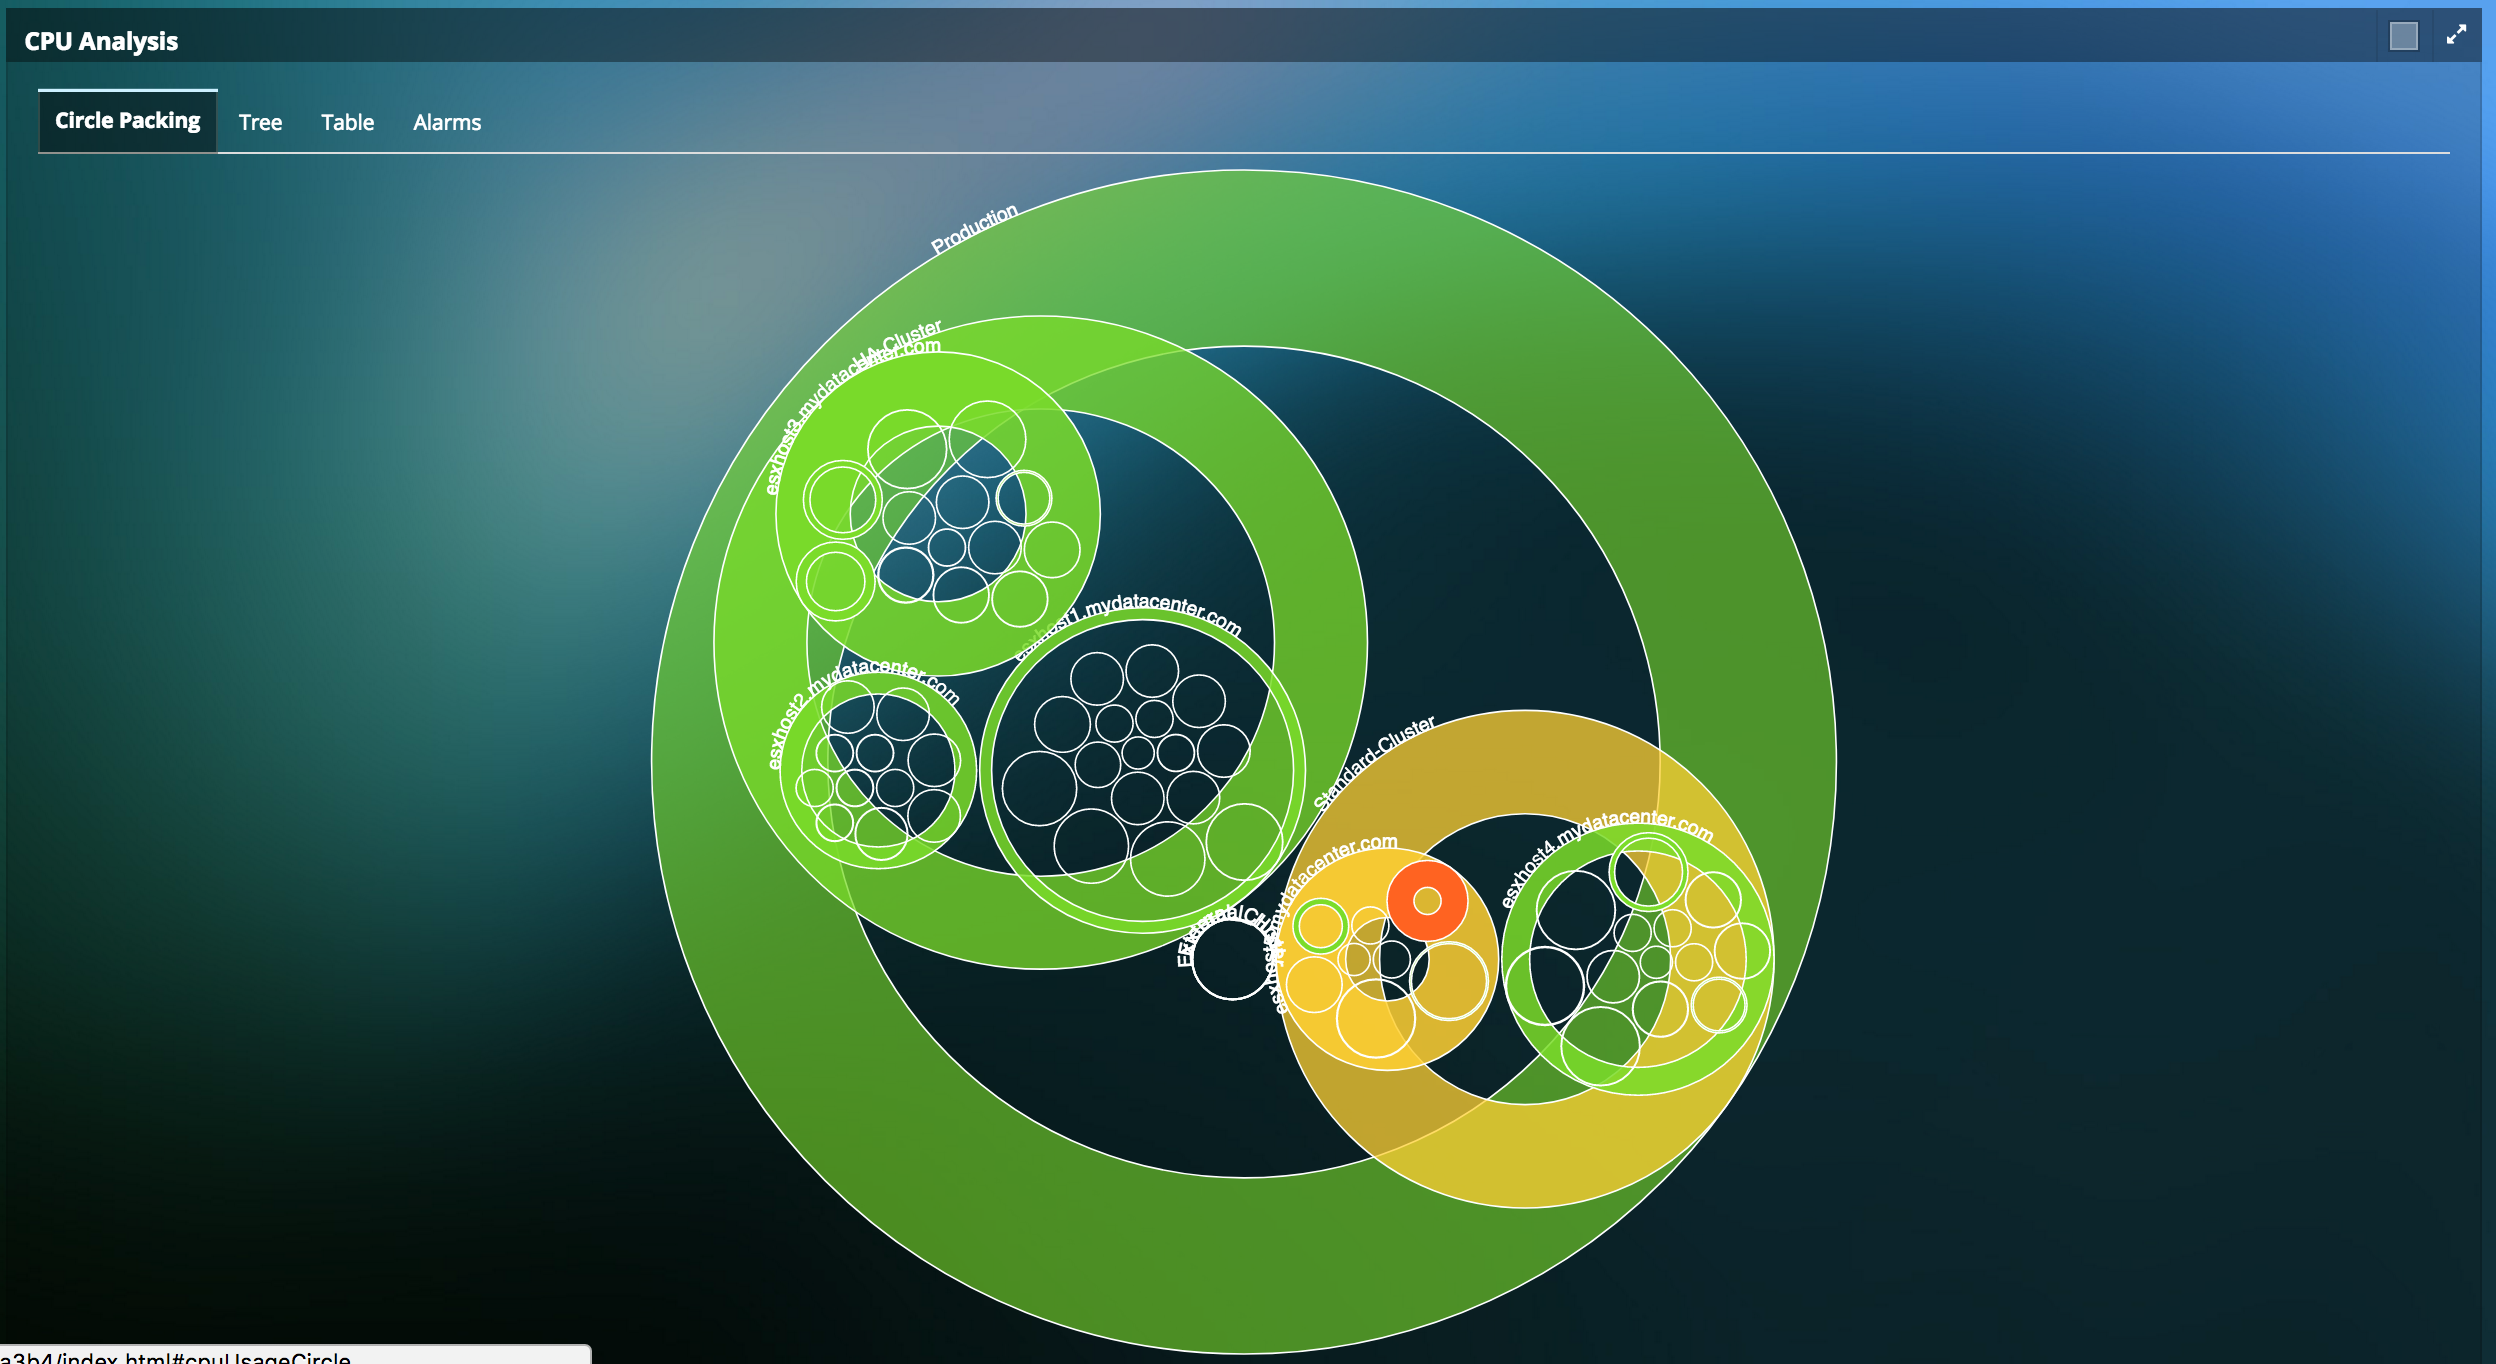
Eliminate pain points within the Compute Infrastructure
.png)
- Visualize how compute performance impacts application performance by measuring metrics such as CPU swap wait, CPU Ready, Utilization and tie this to the Application Response Time.
- Visualize performance of all memory arrays in your hosts with respect to the infrastructure currently running in your data center. Get up-to-date information on memory usage, swap rate, swap wait times, etc.
- Detailed insights into processes using Compute resources.
Read More
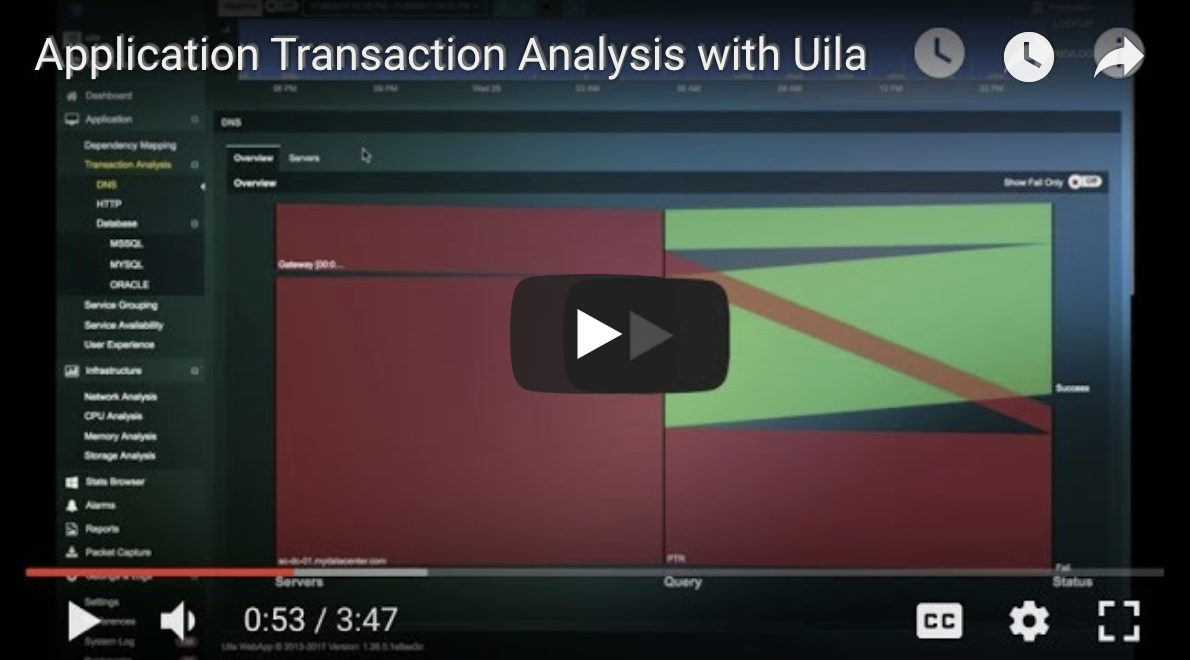
Actionable Application Intelligence and Analysis
- Application auto-discovery for over 3,700 applications (including web, database, Saas, healthcare, financial, industrial, etc.) with Deep Packet Inspection
- Track Application performance response time and service levels constantly to identify bottlenecks and issues.
- Insights into Application transaction metadata (query, response and volume) for deeper investigation.
- Export Application transaction data for forensic evidence.
Read More
Application-centric Virtual and Physical Network Visibility & Troubleshooting
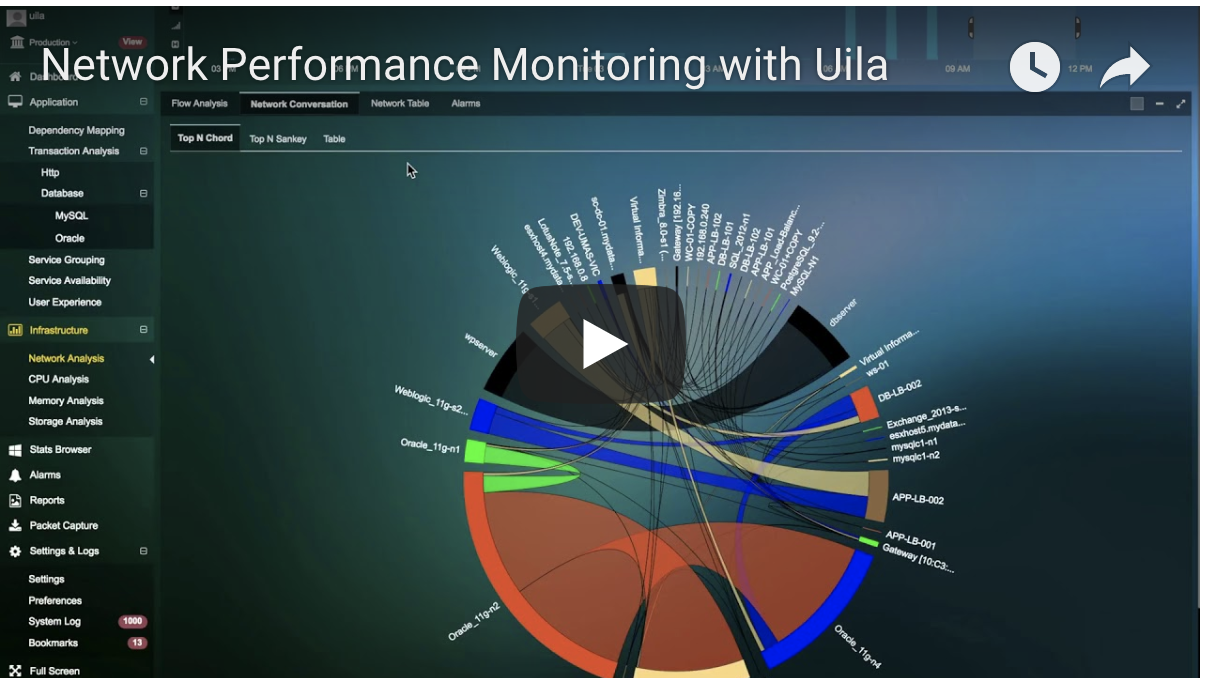
- Virtual Network flow analysis reveals network issues and stress impacting application servers.
- East-west (Lateral) network traffic analysis eliminates monitoring blind spots, and lets IT teams see anomalous traffic between VMs.
- Pinpoint application performance bottleneck down to the physical network port (unavailable, congestion, errors) directly from the Application Dependency Map.
- Get automatically alerted to network traffic violations.
Read More
Centralized Log Analysis for Multi-Cloud deployments
- Instant and automated access to out-of-box correlated and contextualized logs from multiple systems including Windows (Event and Active Directory), IIS servers, Zscaler, Cisco, Barracuda, F5, Checkpoint, Juniper, etc. and applications like Microsoft SQL server, VMware Horizon, IBM MQ, Oracle, Office 365, and much more.
- Contextualized querying and filtering within logs for accelerated troubleshooting and infrastructure management.
- Intelligent full-stack Observability context in an unified console that combines metric and log data to improve IT team efficiencies.
- Choose from over 20+ default searches for most common troubleshooting scenarios or create custom searches for your own unique scenario.
- Get alerted via email, snmp, syslog, etc. to default and custom log search filters.
Read More
Rightsize your Infrastructure Investment
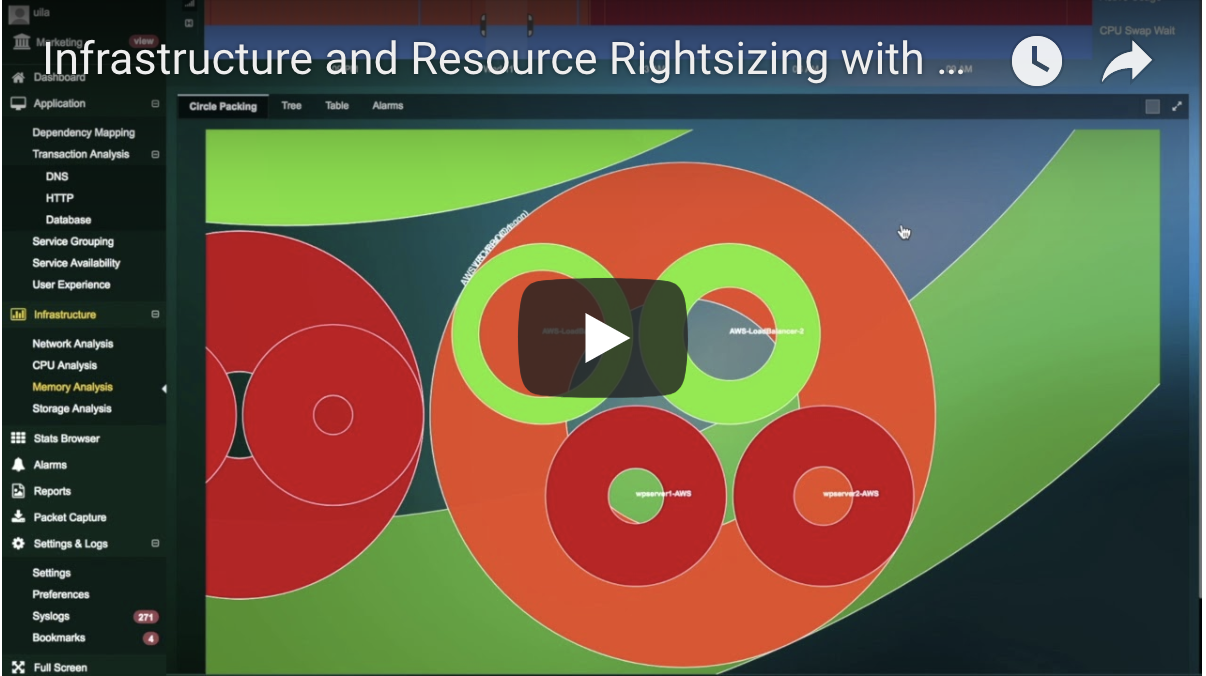
- Optimize application performance with the existing Data Center infrastructure or Cloud resources with clear visibility into future needs, based on existing bottlenecks and hotspots.
- Identify over-provisioned resource issues, and leverage your existing investment.
- Identify under-provisioned resource issues that are impacting business-critical application performance.
- Automate right-sizing guidance report delivery for faster response.
Read More
Full-Stack VDI Performance Management & Troubleshooting
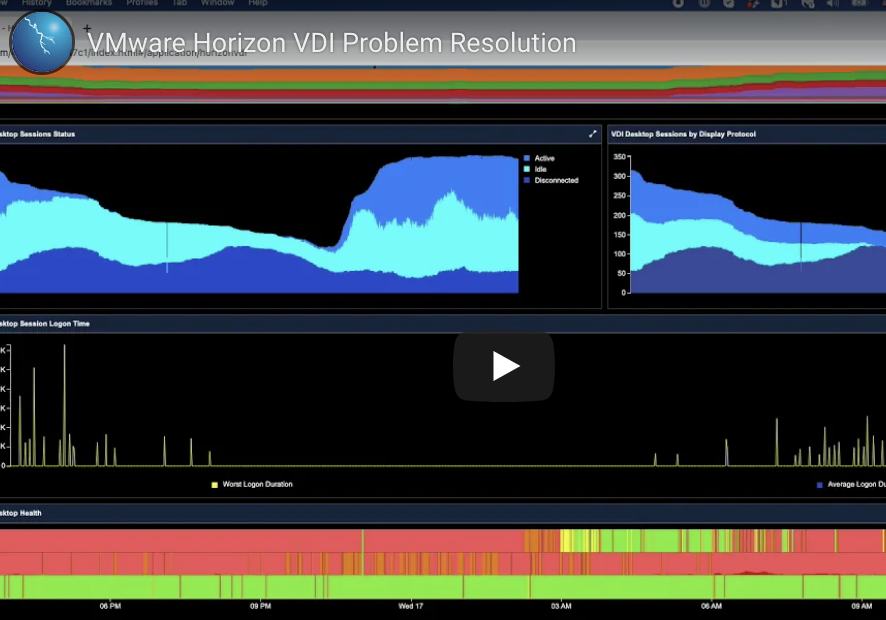
- Pinpoint bottlenecks in the dependency chain for the virtual desktop infrastructure and the business-critical applications that are being serviced by it with automated mapping of end-to-end VDI deployment WITHOUT the installation of any agents.
- Automated correlation between end-user VDI performance and connectivity issues with underlying network, storage and compute performance to get to root-cause before user impact.
- End-user session information for Omnissa Horizon & Citrix clients to pin-point bottlenecks down to the VDI thin-client.
- Visualize more than 4,200 applications in use by VDI clients including web, database, Saas, web-conferencing, website visits,Healthcare, financial, etc.
Read More
Application-centric Alerting to reduce the Alert Noise
- Eliminate Alert Fatigue on Application, Network and Infrastructure with automated baseline and intuitive colored indicators.
- Learn from the past with automated baselining with long periods of data retention.
- Isolate the area of problems and teams responsible for solving them in seconds, and reduce time to resolution and stressful finger-pointing within teams.
Resources
-
Importance of AIOps in Enterprise ITUila's VP of Marketing, Dilip Advani talks about AIOPs and the important role it plays in Enterprise IT.
-
IT Monitoring/Observability Tool ConsolidationQuick video that talks about the challenges of too many silo monitoring tools in an organization, and how they can be overcome with a tool consolidation effort.
-
Challenges with siloed Performance MonitoringWatch Uila CEO talk about siloed Performance Monitoring with vExpert David Davis from Actual Tech Media.
-
Application Performance Monitoring with UilaQuick product video on how to use Uila for Application Performance Monitoring.
-
The Gorilla Guide to... Application-centric IT for Private and Hybrid CloudIn this ebook, you will learn about the advantages of an application-focused approach to IT; Discovery of Application Dependencies to simplify workload migration and resource planning; How to start the journey of developing a "full stack" mindset for managing applications.
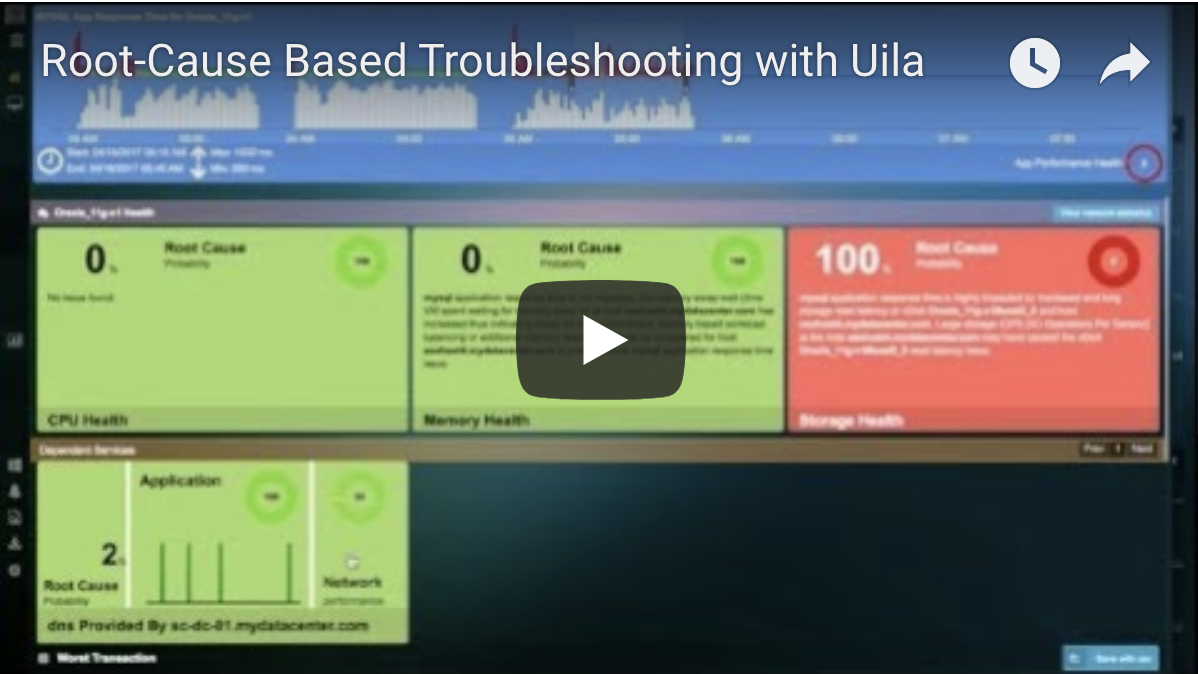
-
Root-Cause Based Troubleshooting with UilaQuick product video on how to use Uila to get to Root Cause for Availability & Performance issues across Private & Hybrid Cloud environments.
-
Full Stack Monitoring with UilaQuick product video on how to use Uila for Full Stack Monitoring.
-
Monitoring and Troubleshooting a Multi-Cloud Deployment with UilaOverview on how to use Uila for Monitoring and Troubleshooting any workload performance outages or issues in a Multi-Cloud deployment.
-
Enterprise Organization with VDI Performance Challenges Success StoryEnterprise organization in Asia that was able to solve their VDI environment's performance issues by isolating the root-cause down to corporate policy violations for a single user.
-
Infrastructure Performance Monitoring with UilaQuick product video on how to use Uila for Infrastructure Performance Monitoring
-
Monitoring Storage Disk Usage with UilaQuick video on how to measure Storage Disk Usage with Uila.
-
What Should a Full-Stack Monitoring Solution Do?Infographic on what full-stack visibility solutions do and why they are a requirement for every IT organization.
-
End-User Experience Monitoring with UilaQuick video on how Uila can be used to see problems from the end user’s point of view, identify root cause, and proactively fix the problems -- often before users even notice.
-
Network Performance Monitoring with UilaQuick product video on how to use Uila for Network Performance Monitoring
Getting Started with Uila's Performance Observability is easy!
Start a 21-day Free Trial Now
Request Trial


